Audience Insights provides you with valuable information about a created Audience, such as Audience Metrics, Audience Overlap, Audience Trends and more. This also helps you to know the Output Identifiersthat are associated with the Audience, providing valuable input for refining your marketing strategies and evaluating campaign performance. To open the Insights for an Audience, click the Insights icon shown in the image below.
In the Audience Insights screen that appears, you can find information about the folder in which the Audience is residing along with the Audience ID, Audience Creation Date, Created By information and Last Updated date. In addition to it, it also contains the following four tabs:
  • Audience Metrics
  • Activation Metrics
  • Audience Overlap
  • Audience Trends

Audience Metrics

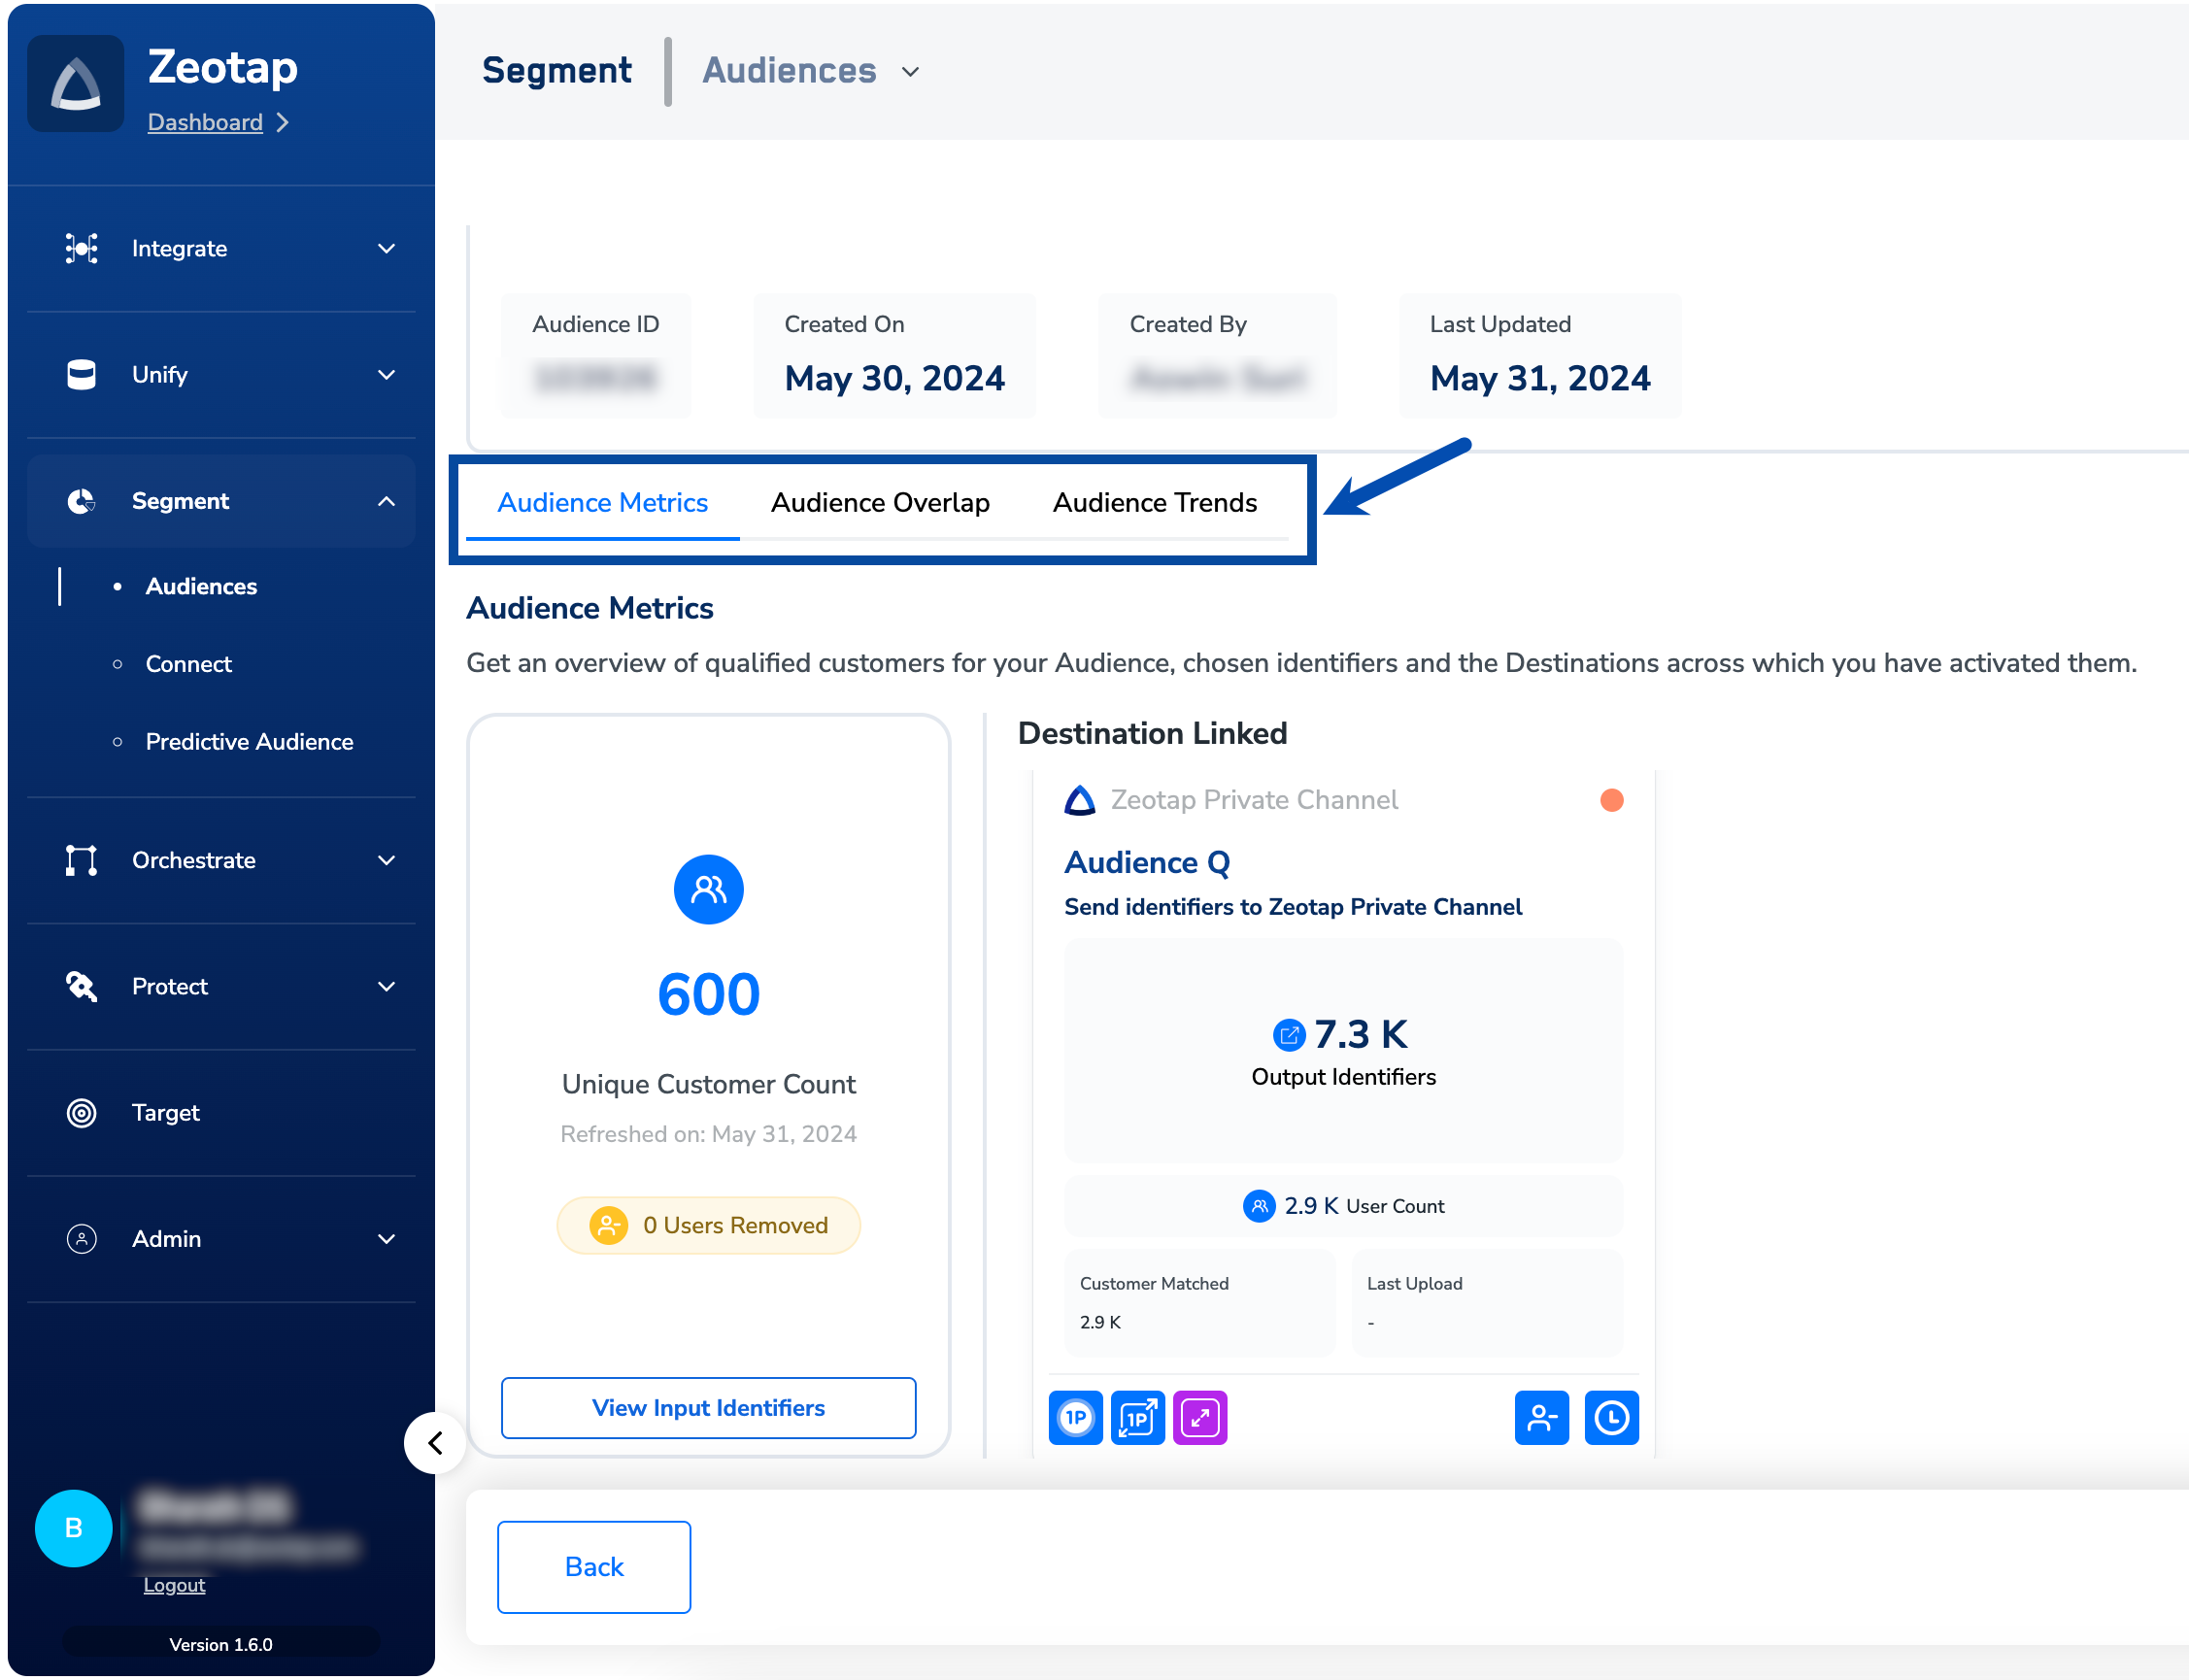
In the Audience Metricstab, you can get an overview of the Unique Customer Count along with the detailed breakup of the Identifiers chosen and the Destinations across which you have activated them.
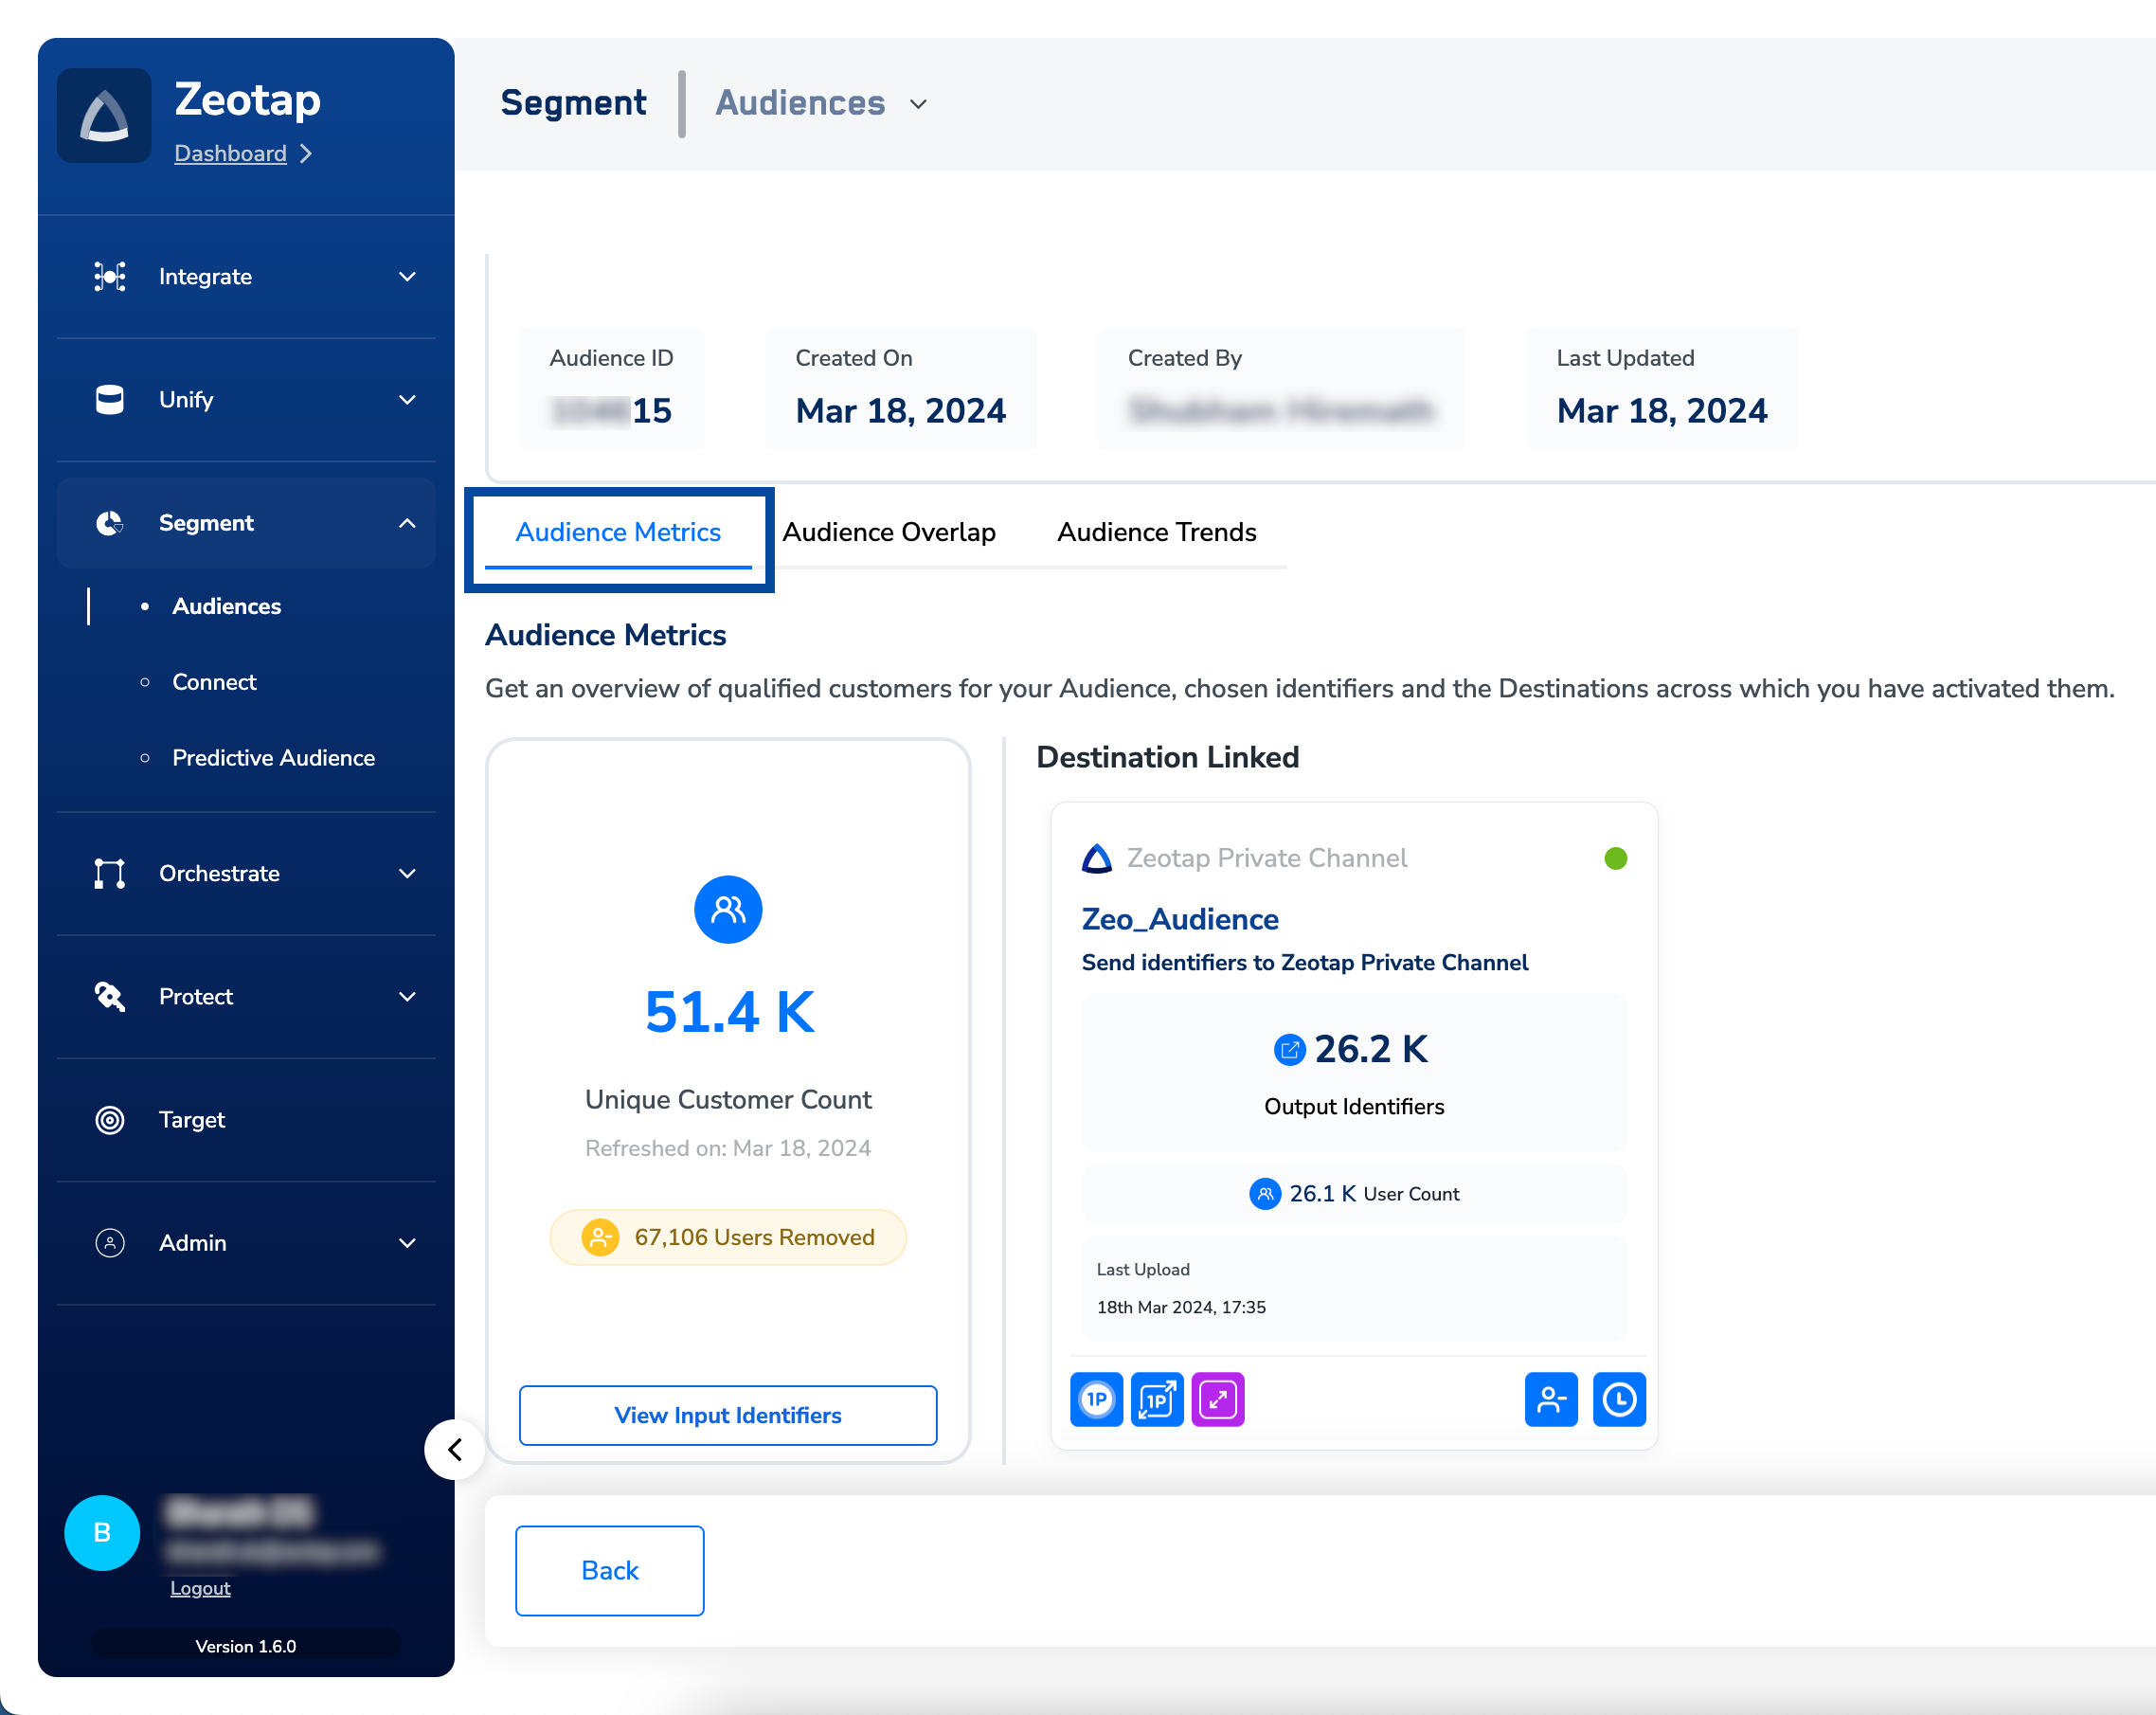
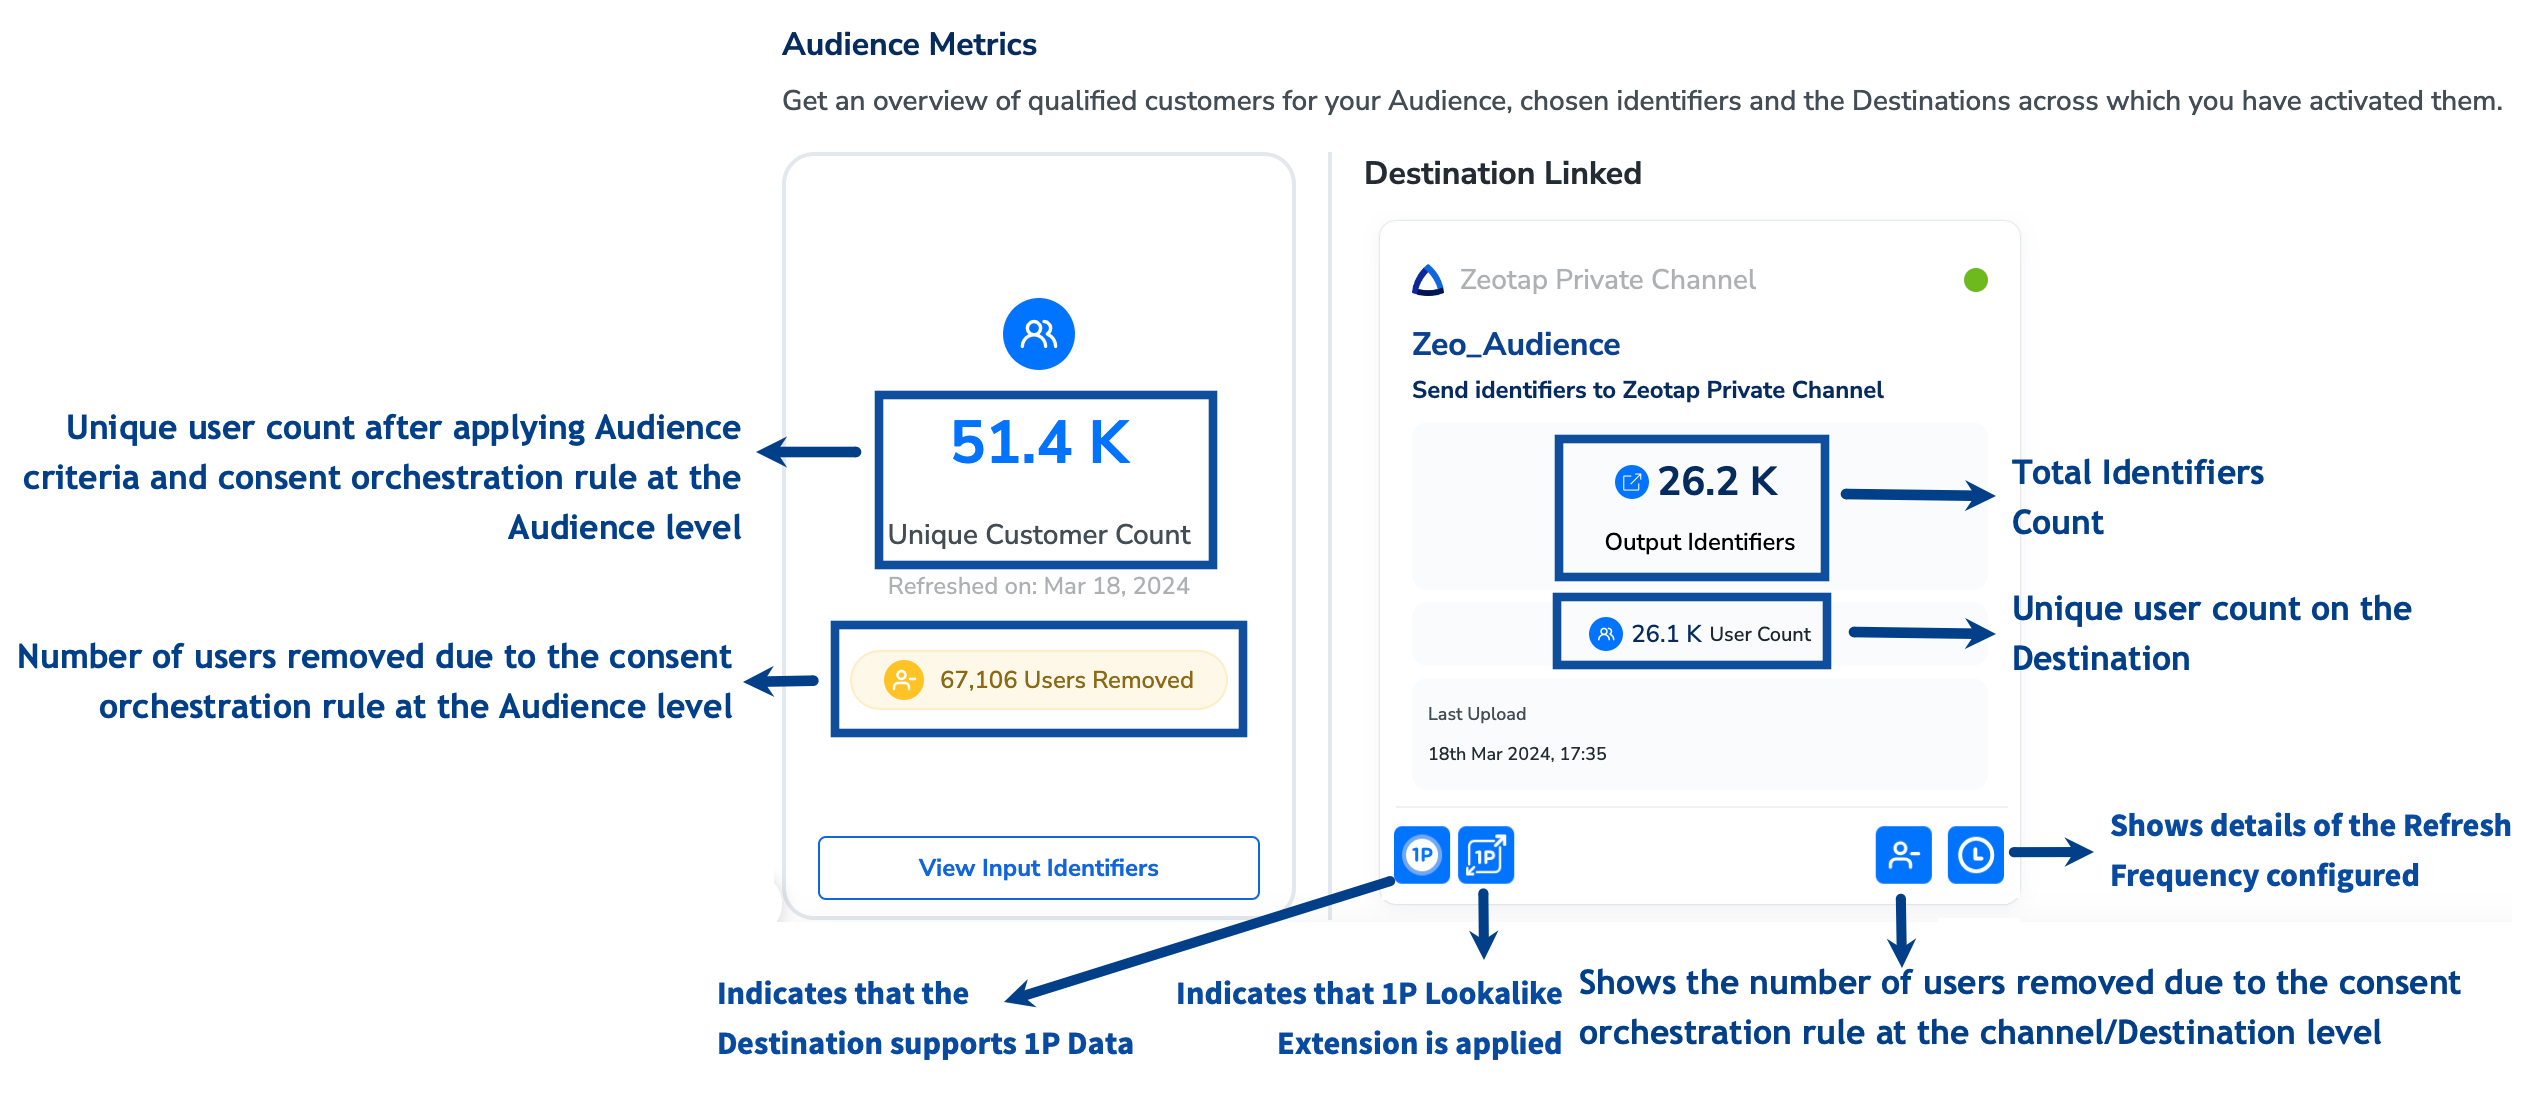
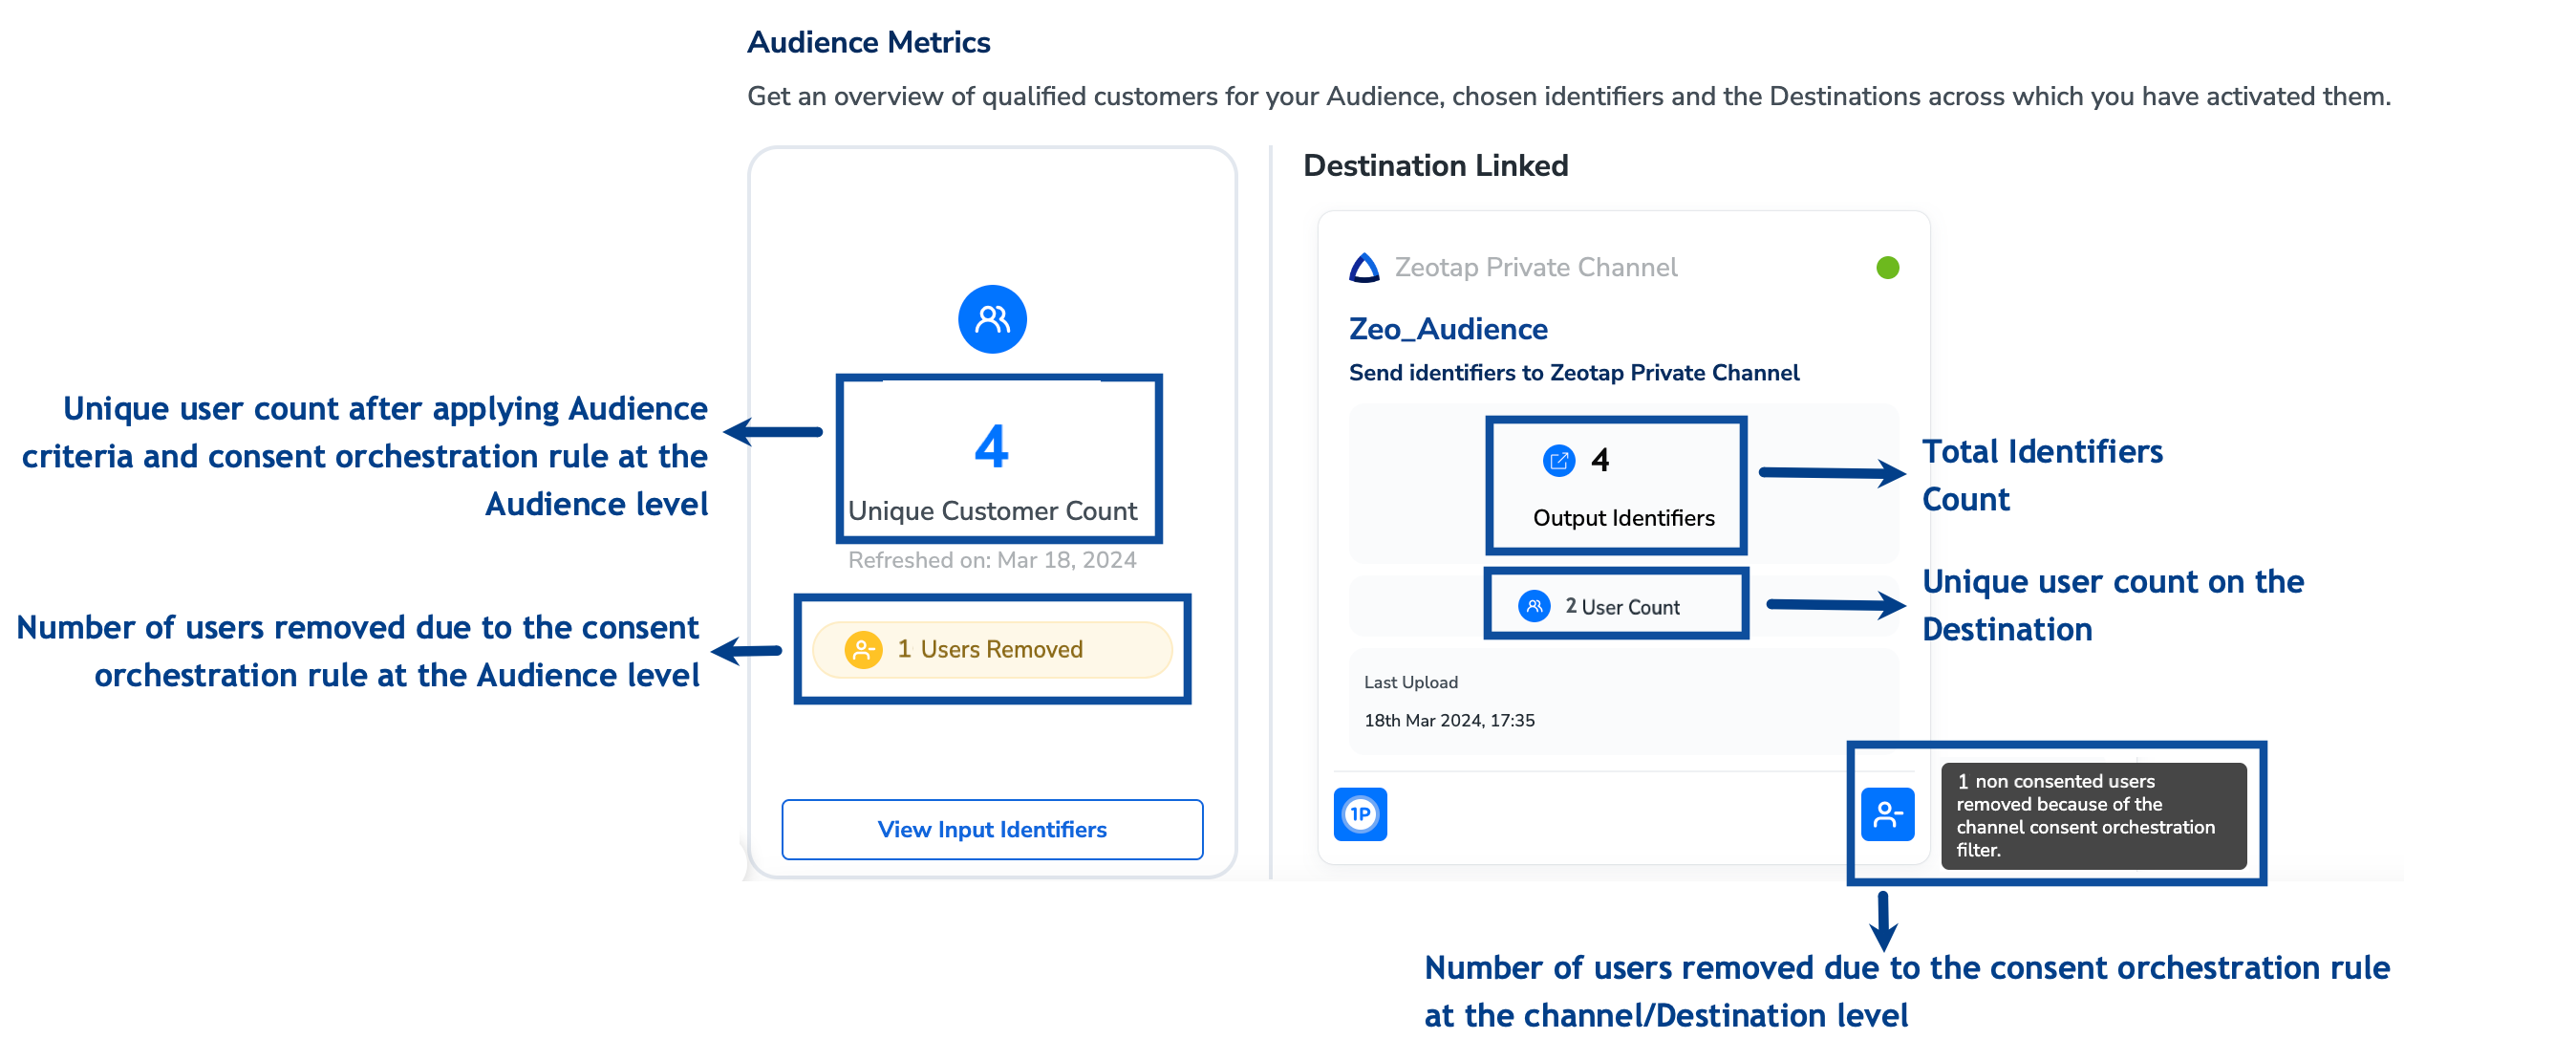
Unique Customer Count - This represents the count of unique customers meeting the criteria you have set for your Audience after applying Consent Rule at Audience Level. The unique customer count updates with each audience refresh for all activation types. Track the trend for this count in the Audience Trends section of Audience Insights. In addition, you can also view the count of identifiers associated with these unique customers under View Input Identifier section. To view the detailed breakup of your Audience, click View Input Identifiersunder Unique Customer Count. This helps you to define the activation strategy for the Audience. Note that the unique customers count is not always equal to the sum of the individual IDs. This is because a single user can have multiple IDs such as email, phone, Maid and Google cookie, which cannot be considered as a unique ID.

Understand Audience Metrics with a Use Case

To understand how to interpret the various counts available on the Audience Metrics tab, let’s consider an example. Assuming all user profiles listed in the table below meet the Audience Criteria, we can determine the counts based on their compliance with the consent rules set at the Audience and channel levels, as well as the availability of output identifiers accepted by the Destination. The resulting counts are detailed in the Result section. Assumptions
  • All the below user profiles meet the Audience criteria.
  • The chosen Destination accepts MAIDs and Phone numbers as output identifiers.
ProfilesEmail Address AvailablePhone Number AvailableMAIDs AvailableAudience Consent AvailableChannel Consent Available
UCID 1YesYesYesYesYes
UCID 2YesYesNoNoYes
UCID 3YesYesYesYesYes
UCID 4NoNoYesYesNo
UCID 5YesNoNoYesYes
**Result
Audience Level AnalysisDestination Level Analysis
Unique Customer Count: 4Reasoning:
  • Users qualifying Audience criteria: UCID 1, UCID 3, UCID 4 and UCID 5

  • Users removed due to consent rule set at Audience level: 1 (UCID 2)

Output Identifier Count: 4
  • UCID 1 and UCID 3 have both MAIDs and Phone numbers as output identifiers.

User Count: 2
  • UCID 1 and UCID 3 qualify all the following criteria:

    • Audience criteria

    • Consent rule set at Audience level

    • Accepts both MAIDs and Phone numbers as output identifiers

    • Consent rule set at channel level

Users removed due to Consent rule set at channel level: 1 (UCID 4)

How to View Insights for an A/B Test enabled Audience?

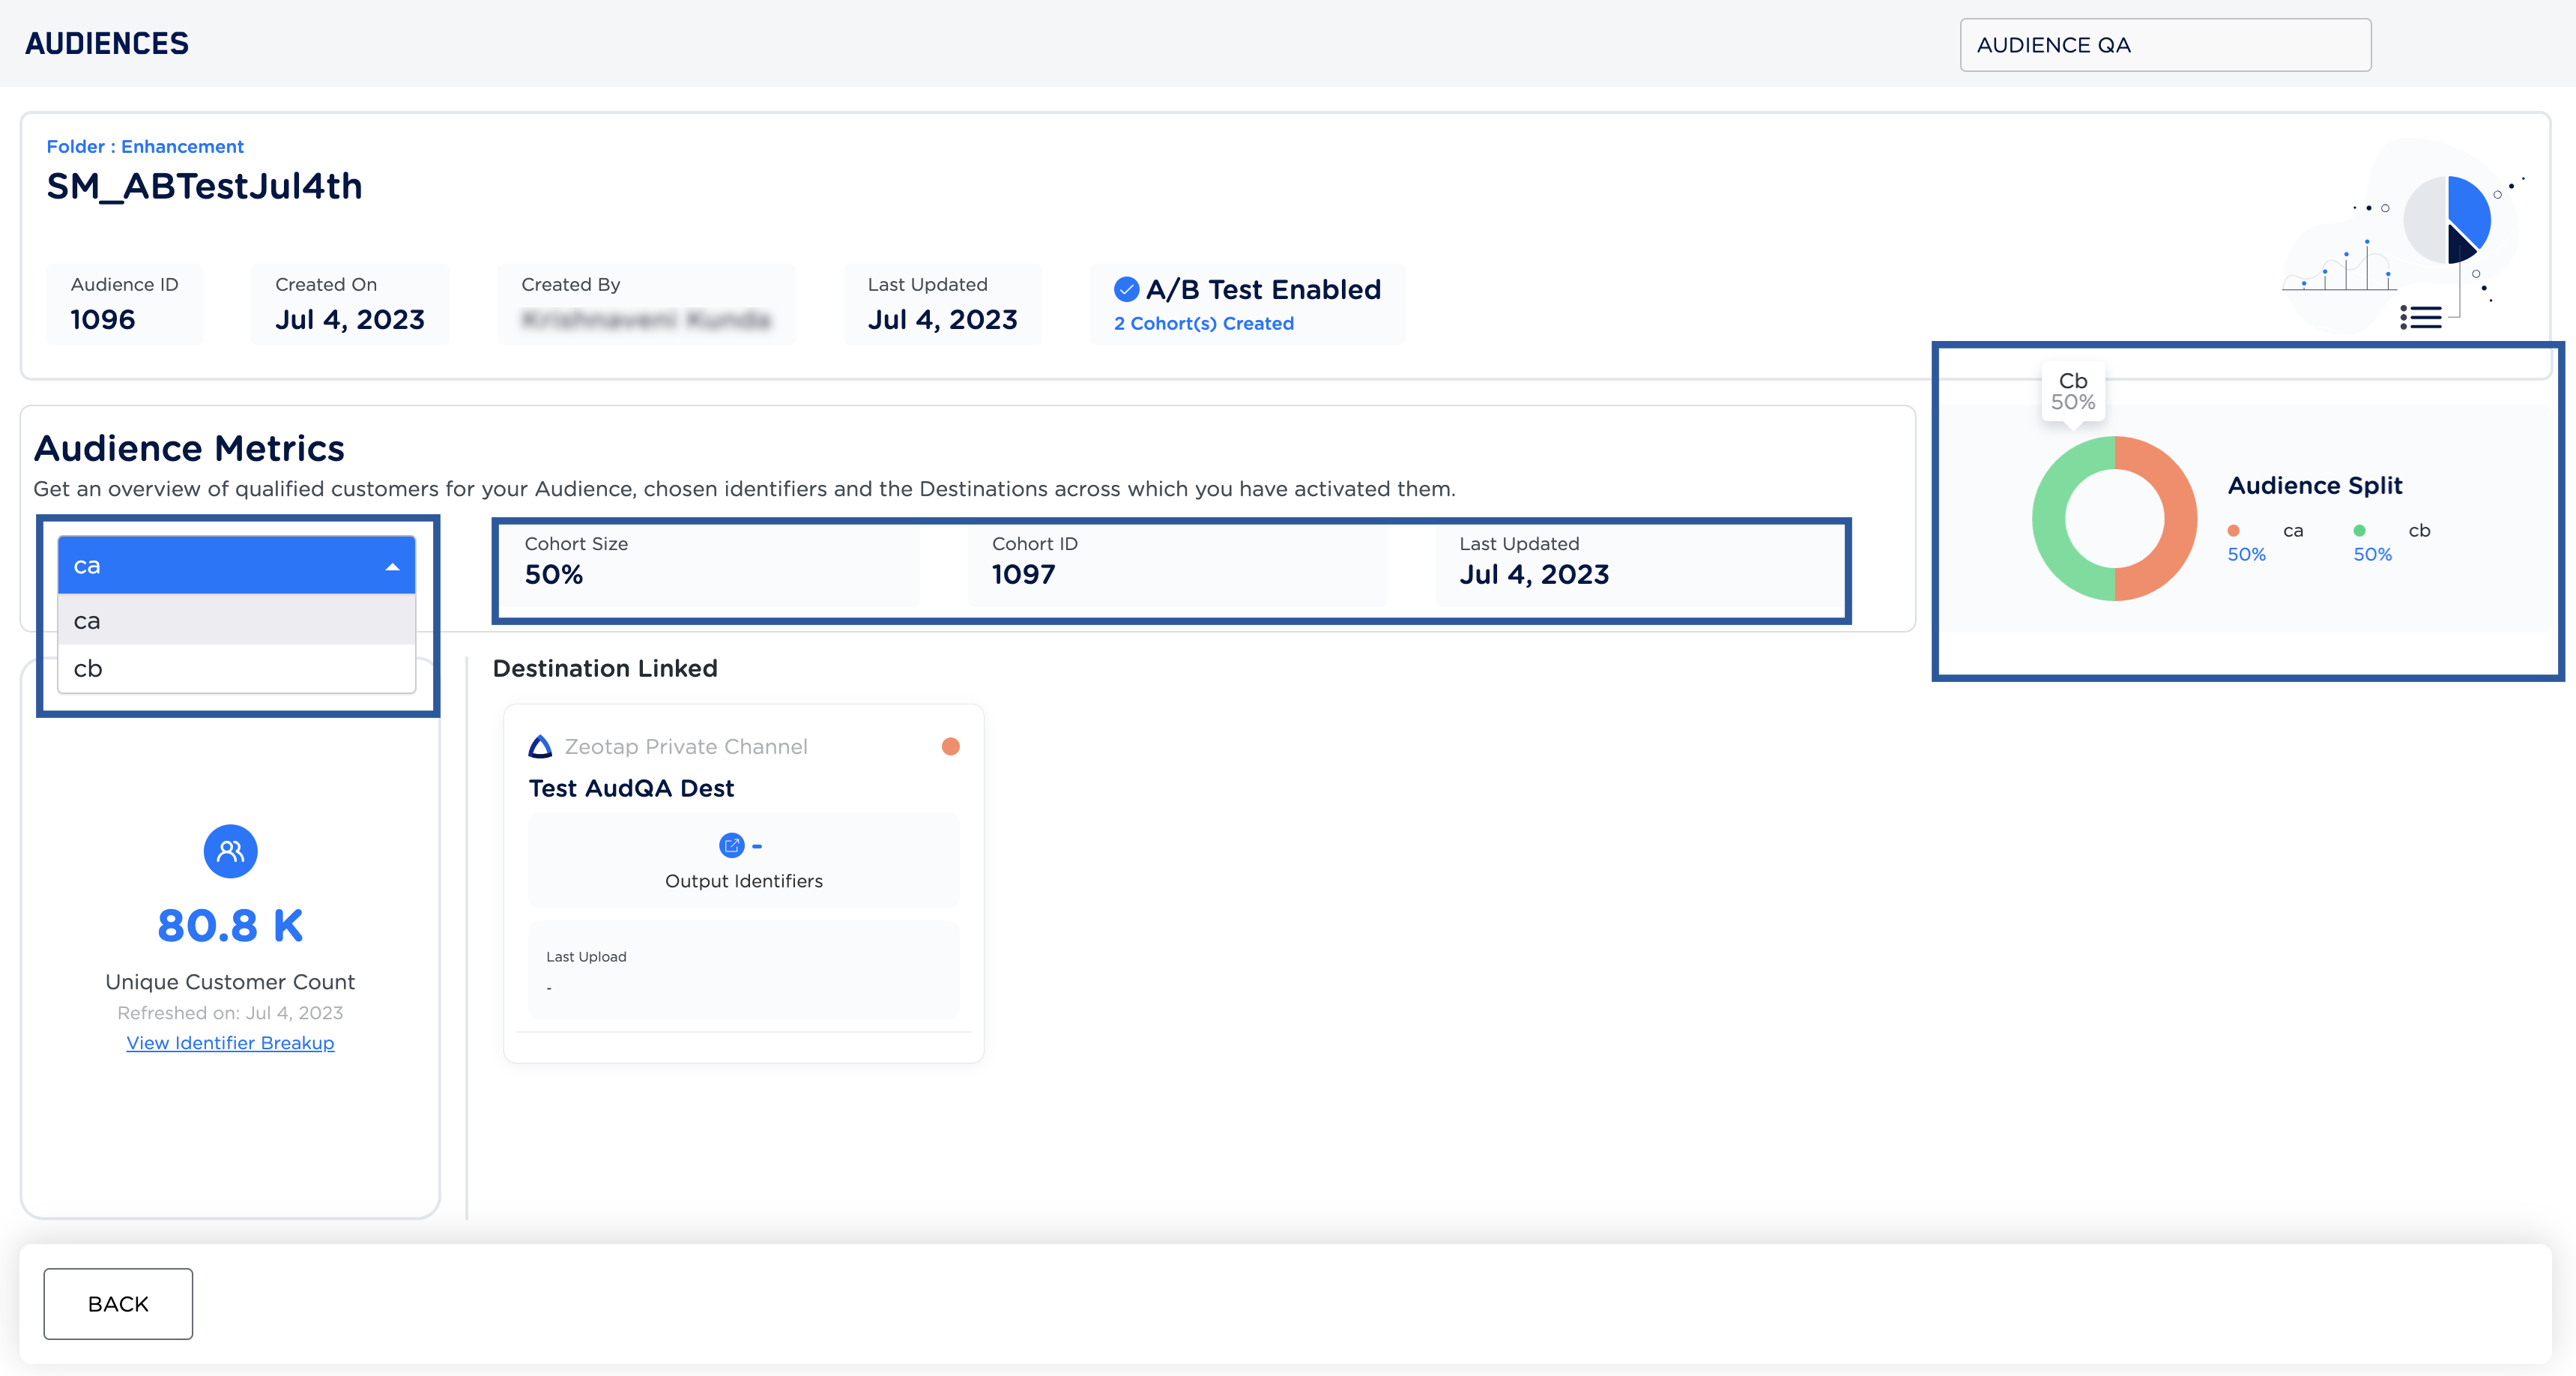
When you check the Audience Insights for an A/B Testing enabled Audience, you can choose the cohort for which you wish to view the metrics. Once chosen, the screen displays relevant information about the selected cohort, including the Cohort Size, Cohort ID, and Last Updated date. By hovering over the Audience Split circle, you can also see the percentage share of each cohort. The process of viewing Audience metrics and the linked Destinations for each cohort is similar to the method mentioned above.
Activation Metrics

When Destinations are linked to an Audience, each Destination is presented as a Destination Card in the Activation Metrics tab. These cards give you an at-a-glance summary of activation readiness and real-time performance for each linked Destination, without needing to open the detailed view. When Audience Boost is enabled on an Audience, the tab displays two side-by-side cards for the same Destination — one for the Boosted audience and one for the Seed (base 1P) audience. This lets you directly compare identifier uplift and Destination reach between the boosted and the baseline audience.
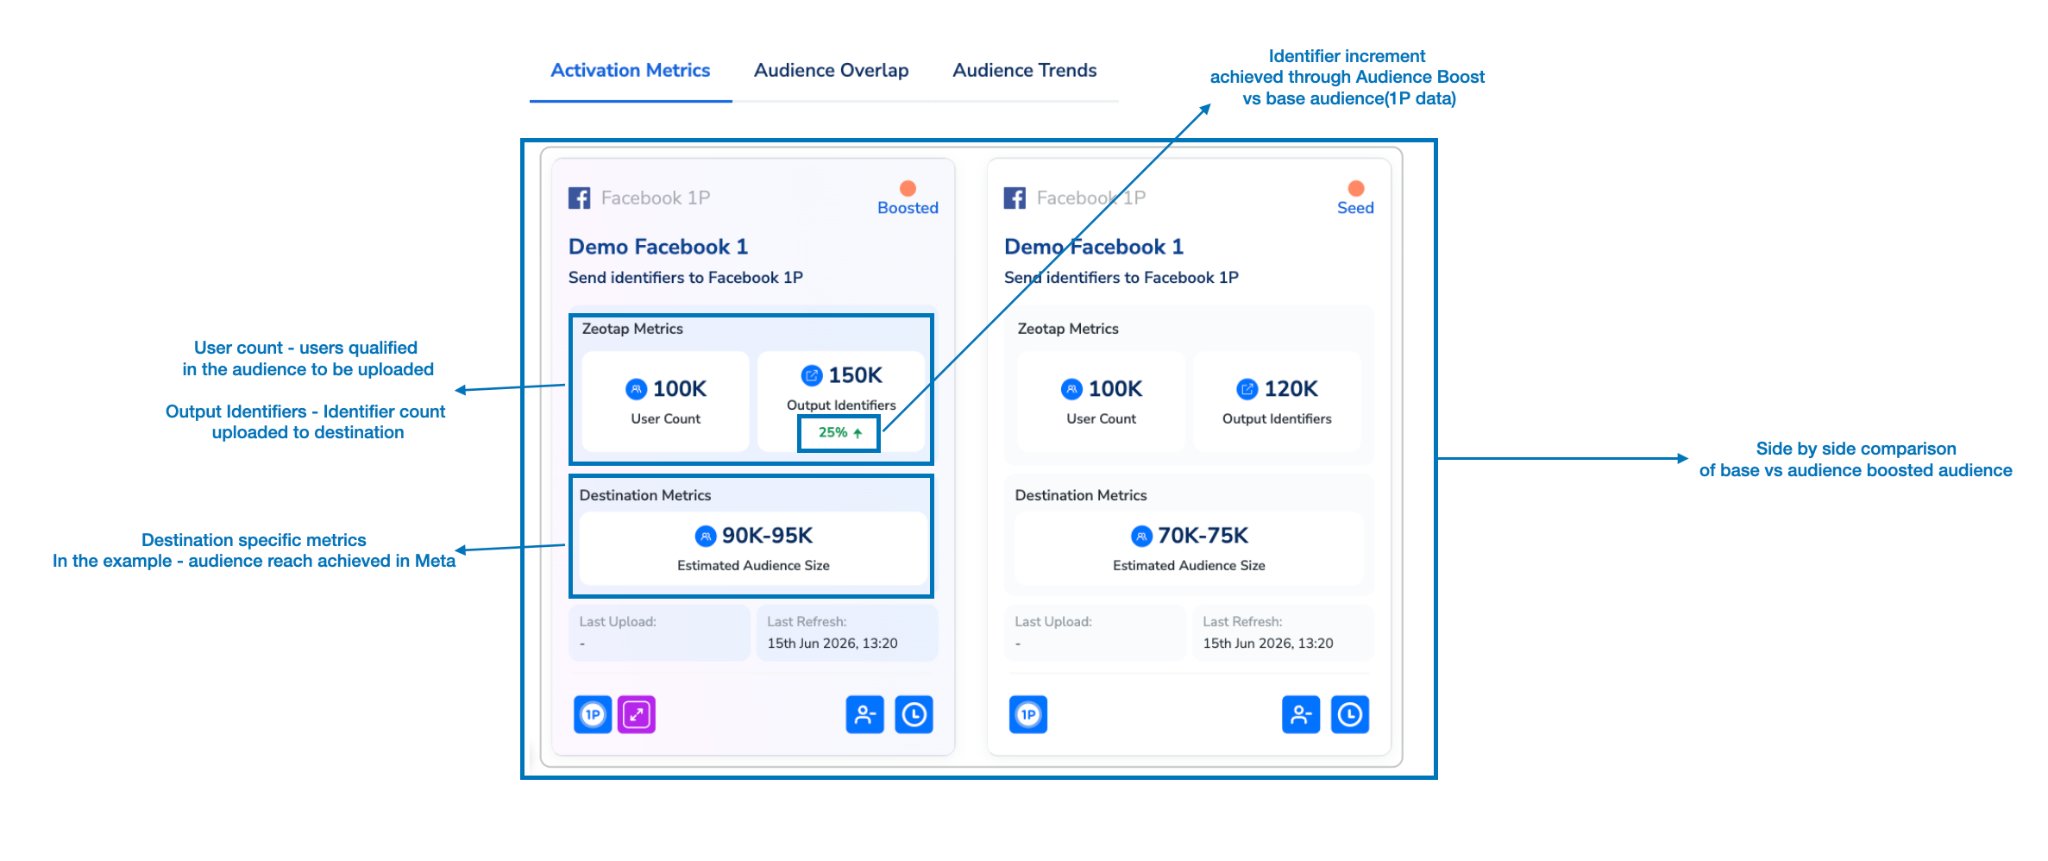
Fields on Each Destination Card Each card in the Activation Metrics tab surfaces the following information:
FieldDescription
Destination NameThe name of the Destination connector and its mapping label (for example, Demo Facebook 1 — Send identifiers to Facebook 1P).
Audience TagBoosted or Seed — indicates whether the card represents the Audience Boost–enriched audience or the original 1P seed audience. Only visible when Audience Boost is active on the Audience.
User CountThe number of unique users in the audience who are qualified to be uploaded to this Destination.
Output IdentifiersThe total count of identifiers (emails, MAIDs, phone numbers, and so on) that will be sent to the Destination for activation. When Audience Boost is active, this count is higher on the Boosted card than on the Seed card.
Identifier IncrementA percentage badge (for example, 25% ↑) shown on the Boosted card indicating the uplift in Output Identifiers achieved through Audience Boost compared to the Seed (base 1P) audience.
Destination MetricsDestination-specific performance metrics returned by the destination platform (for example, an Estimated Audience Size of 90K–95K in Meta). See the note below on availability.
Last UploadTimestamp of the last data upload sent to the Destination. A dash (–) indicates no upload has occurred yet.
Last RefreshTimestamp of the most recent audience refresh cycle, reflecting when membership was last recomputed and synced to the Destination.
Destination Metrics Availability:Destination Metrics (such as Estimated Audience Size) are not available for all Destinations. They are only surfaced for Destinations where the destination platform provides feedback data back to Zeotap (for example, Meta). For Destinations that do not support this feedback loop, the Destination Metrics section does not appear on the card.

Destination Card — Detailed View

Clicking any Destination Card opens a detailed panel for that specific Destination mapping. This panel surfaces granular metadata, identifier breakdowns, and destination-level performance data.
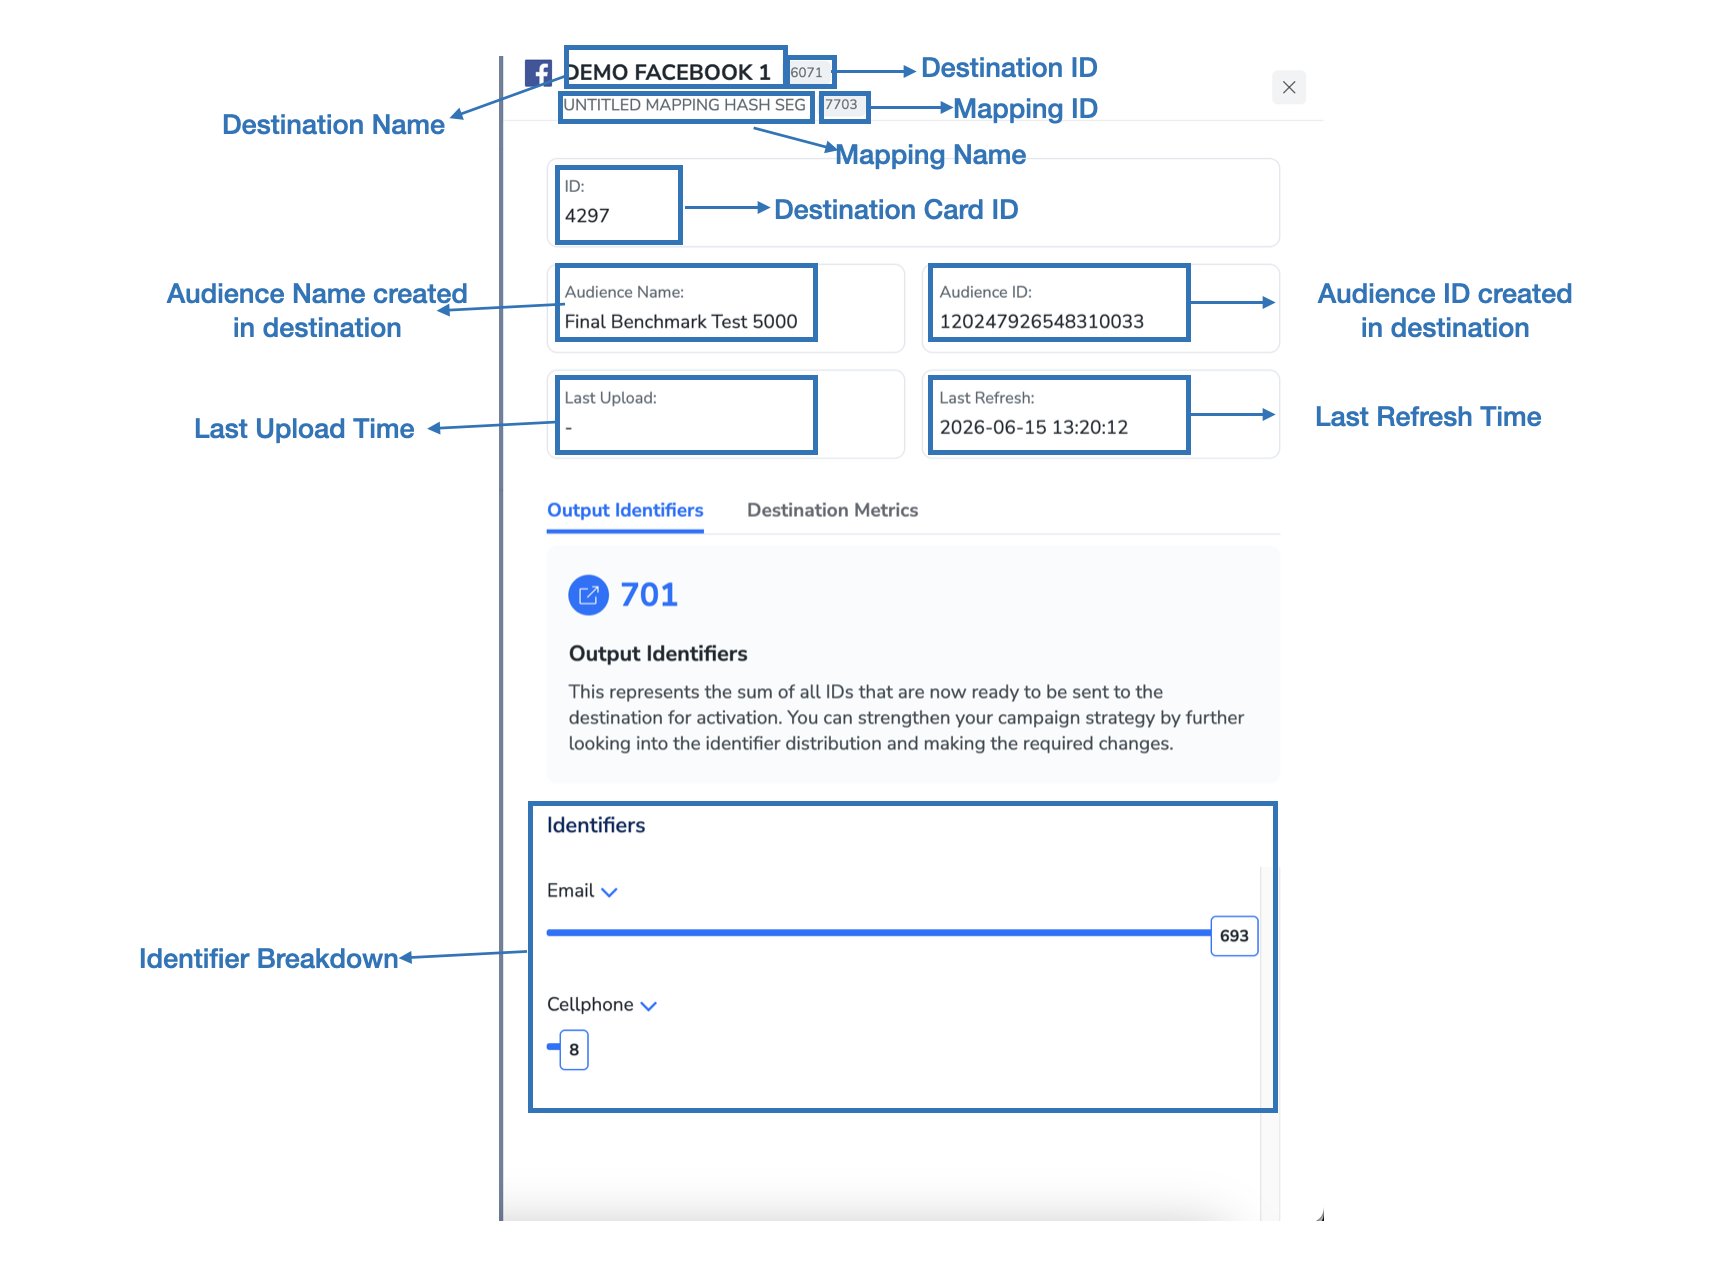
The detailed panel exposes the following fields:
FieldDescription
Destination NameThe name of the Destination connector configured in Zeotap CDP (for example, DEMO FACEBOOK 1).
Destination IDA unique numeric identifier assigned to the Destination configuration.
Mapping NameThe name of the Audience-to-Destination mapping (for example, UNTITLED MAPPING HASH SEG).
Mapping IDA unique numeric identifier assigned to the specific Audience–Destination mapping.
Destination Card IDAn internal reference ID (shown as ID) that uniquely identifies this card record within the Zeotap platform.
Audience Name in destinationThe name under which the Audience is registered in the destination platform (for example, Final Benchmark Test 5000 in Meta Ads Manager).
Audience ID in destinationThe unique identifier assigned to the Audience by the destination platform (for example, the Facebook Custom Audience ID).
Last UploadTimestamp of the most recent data upload sent to the Destination. A dash (–) indicates no upload has occurred yet.
Last RefreshTimestamp of the most recent audience refresh, reflecting when membership was last recomputed and synced.
Output Identifiers Tab The Output Identifiers tab within the detail panel shows the total count of all IDs ready for activation on this Destination, after Consent Rule at Audience Level and Consent Rule at Channel Level have been applied. Beneath the total, the Identifiers section shows a per-identifier-type breakdown as a horizontal bar chart. This helps you evaluate identifier coverage and adjust your activation strategy accordingly.
Note:The Output Identifiers count reflects identifiers meeting the criteria set for your Audience after applying both Consent Rule at Audience Level and Consent Rule at Channel Level.

Audience Overlap

Audience Overlap denotes the shared customer percentage between two Audiences, providing valuable insights into customer behaviour for effective marketing strategies. It refreshes every three (3) hours. Let’s consider the following example showcasing the Audience Overlap feature: Consider two distinct Audiences mentioned below.
  • Audience A - Targets 2.5K unique Fitness Enthusiasts interested in gym memberships, workout apparel and fitness equipment.
  • Audience B - Targets 177.9K unique Healthy Cooking Enthusiasts interested in organic food, recipe books and cooking utensils.
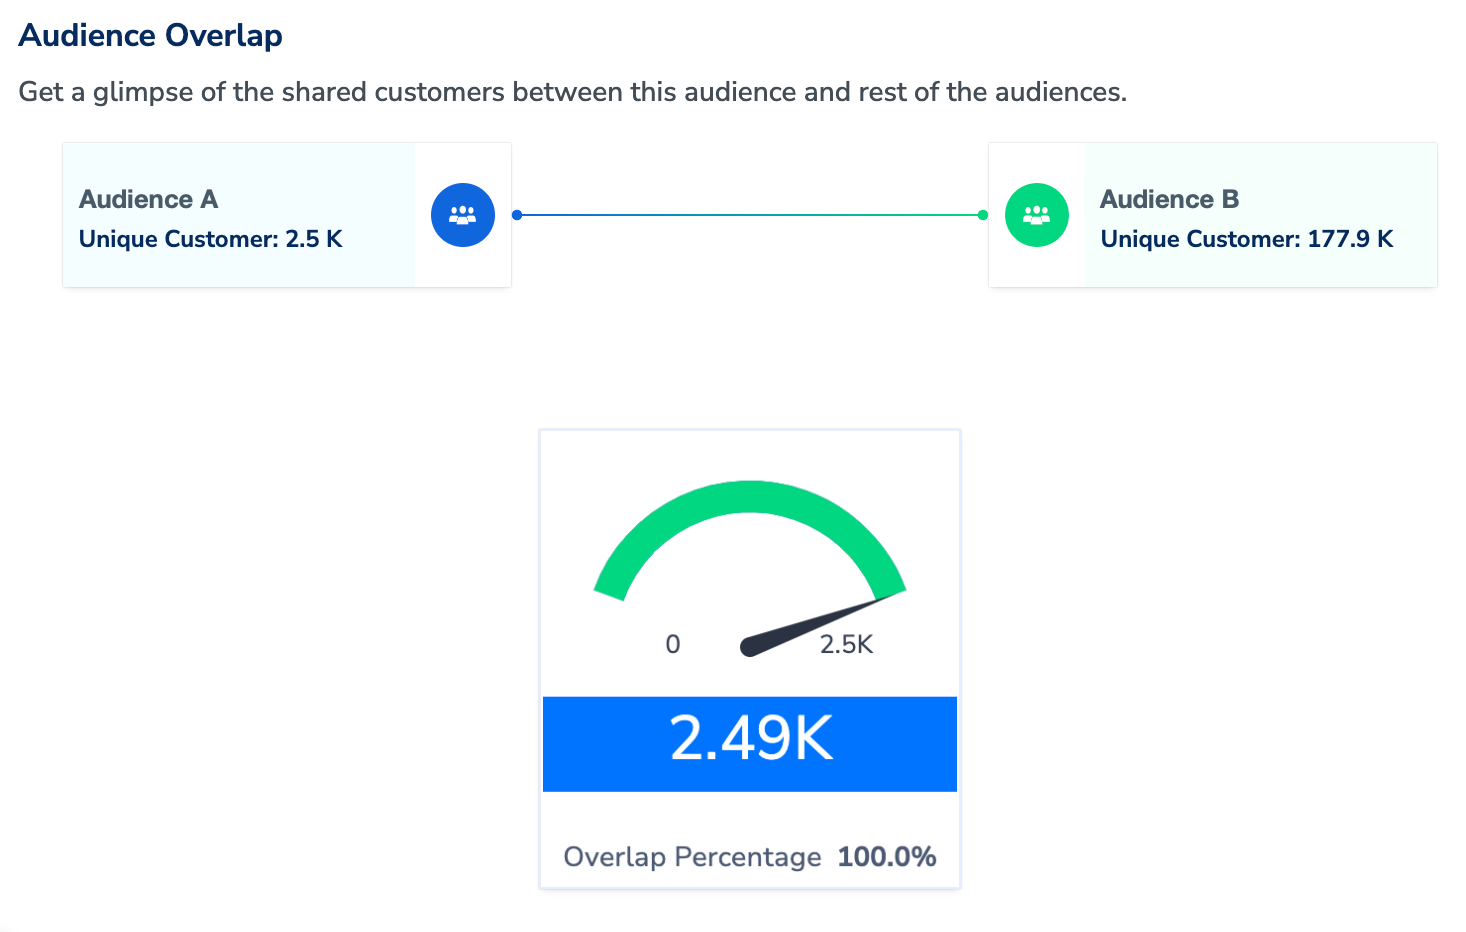
Upon checking the Audience Overlap between these audiences, it’s found that 2.5K customers are common to both. This overlap can be used to develop joint promotions/combined packages, ensuring tailored content and preventing ad fatigue among these customers.
Note:The error in the overlap percentage is higher when the number of shared users is less than 1000 for the compared Audiences. Hence, exercise caution while using the Overlap functionality.

How to Use Audience Overlap?

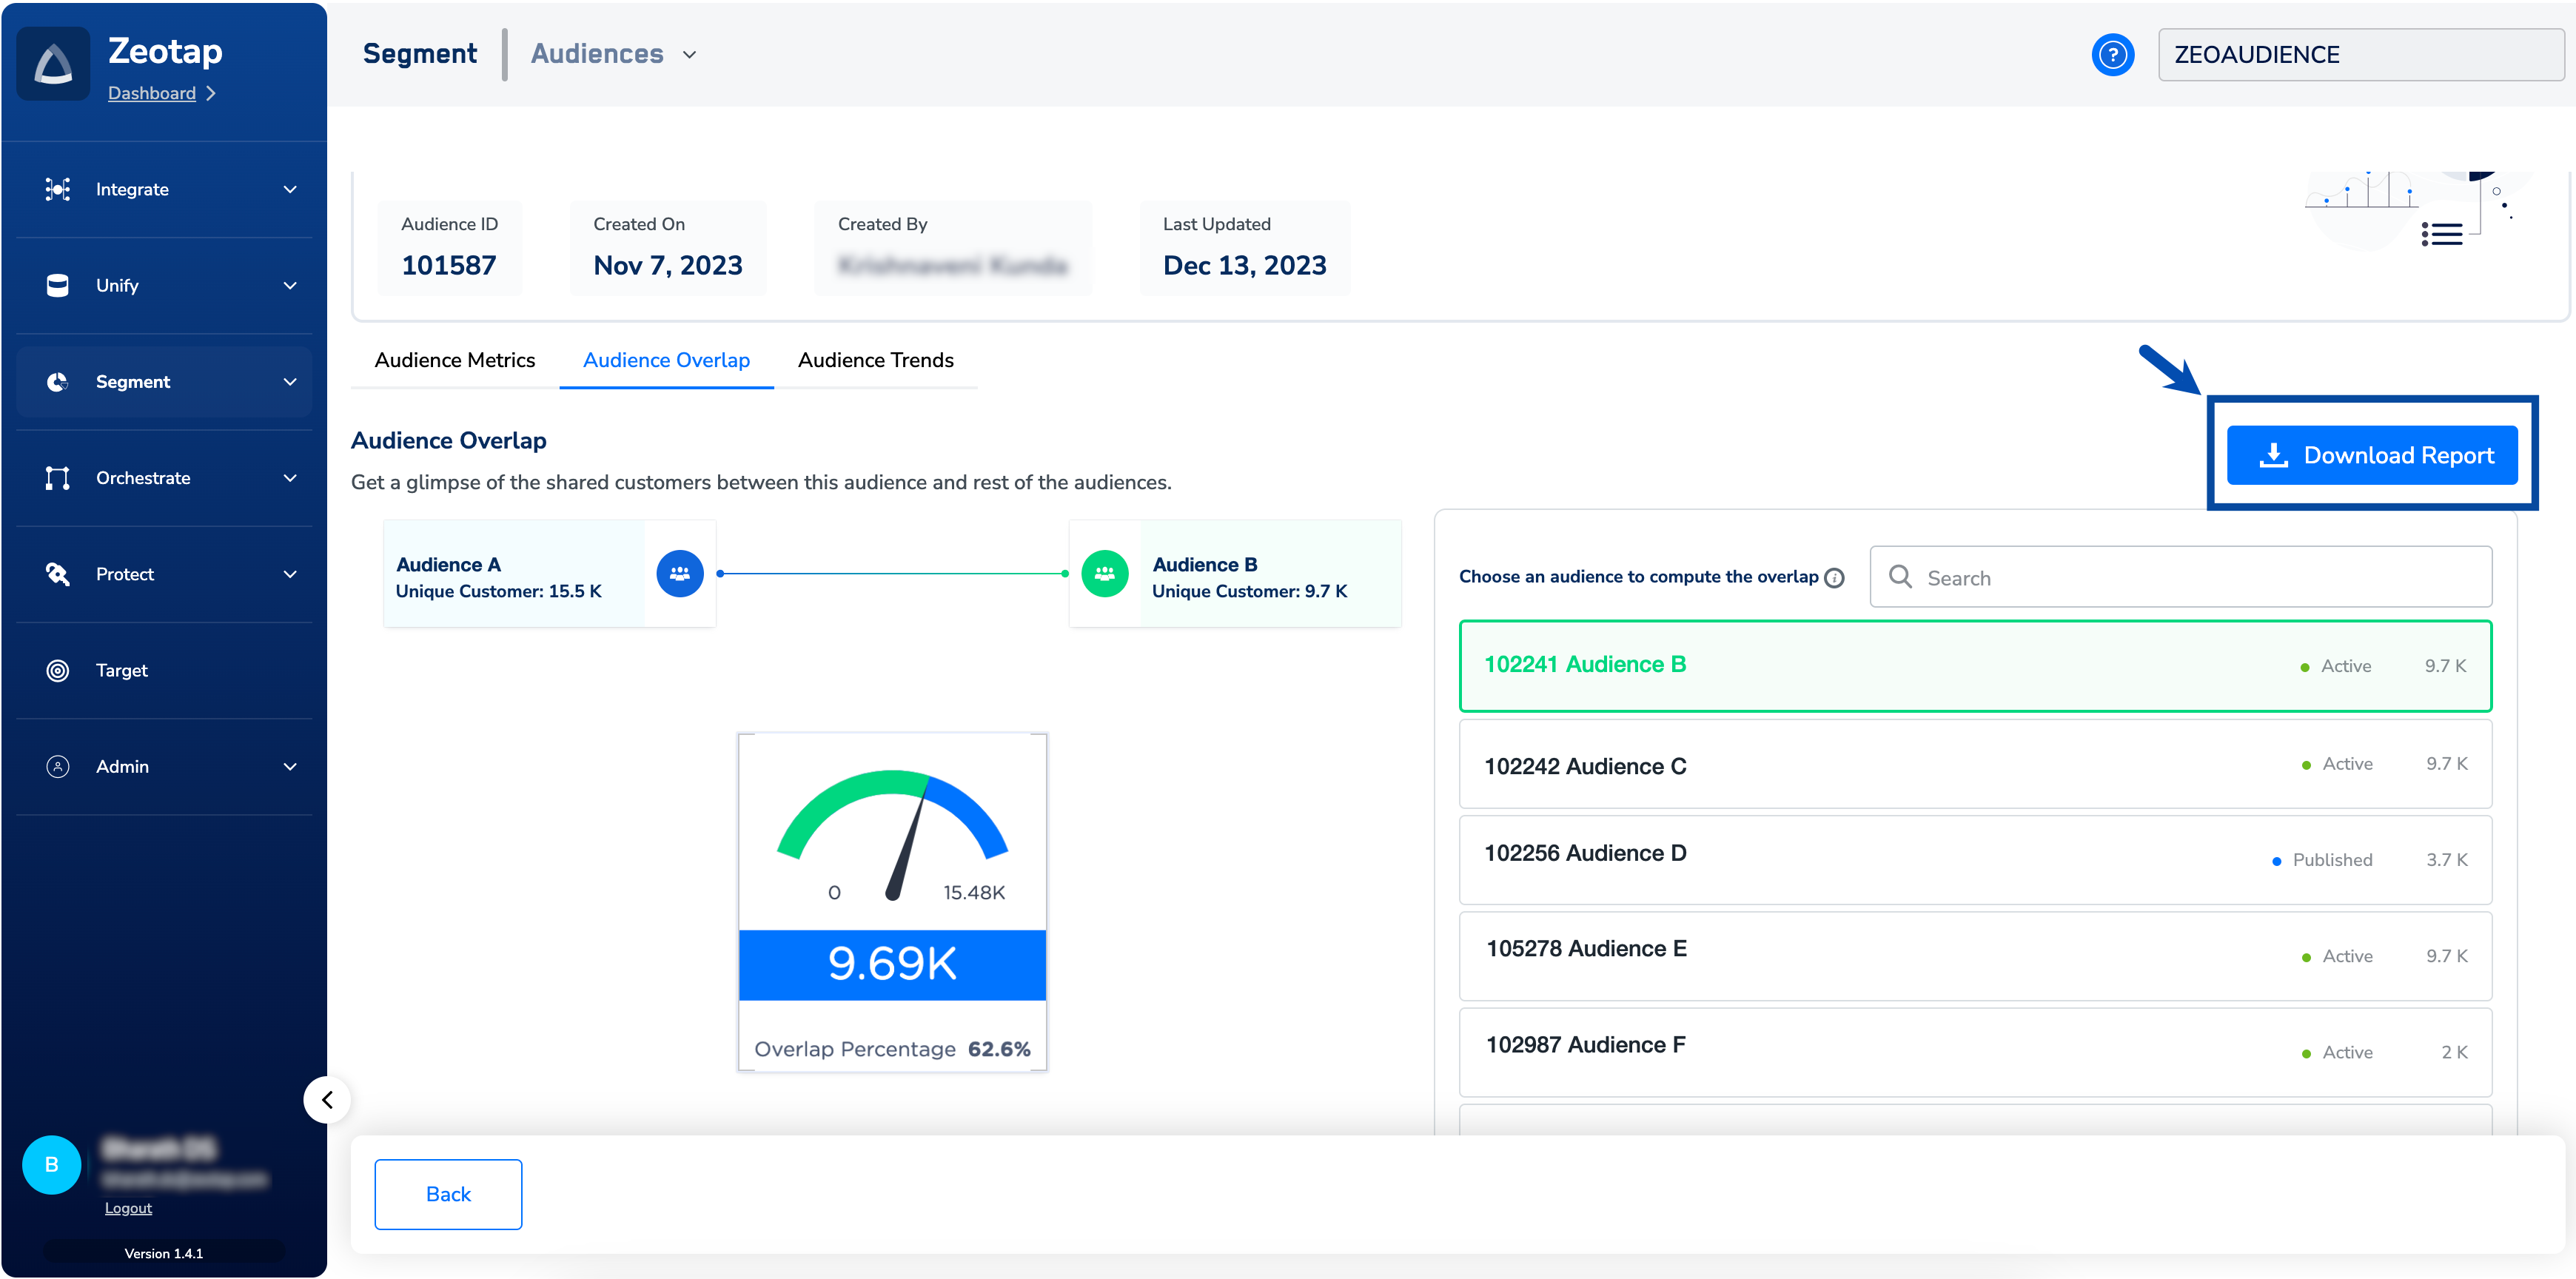
In the Audience Overlap tab, you can view the unique customer counts of the two Audiences that your are comparing, along with the count of customers common to both. Note that one of the Audience has to be the one that you are working on, while you can choose the other Audience from the rest of the Audiences in Active and Published statuses, either by using the search box or by scrolling through the list. The overlap count and percentage may differ depending on the Audience you choose. You can download the complete overlap report of the selected audience with all existing audiences in the account by using the Download Report button shown in the image below. The report will be a CSV file showing the percentage overlap of the selected audience with all the other audiences in the account.
In the Audience Trends tab, you can view real-time insights of your audience as per the configured refresh frequency. The count of qualified customers dynamically updates with the inflow of new data and qualifying criteria for the audience segment. Zeotap facilitates a retrospective analysis of your audience over the past 30, 60 or 90 days. The Audience Trends refreshes every three (3) hours.
Within the platform, a trend graph is presented, depicting the timeline of audience refresh on the X-axis and the volume of unique customers qualifying for your audience or the number of output identifiers being sent to a destination, on the Y-axis. Note that these insights includes customers who may have been disassociated from the audience due to evolving qualifying criteria, providing a holistic perspective on audience dynamics.
Last modified on June 17, 2026