

What this is
The Source Listing page is the main view in the Zeotap CDP’s Integrate module where every source you have created is displayed alongside its category, lifecycle status, record counts, and last-refresh timestamps. Use it to check whether a new source is receiving data, whether an existing source has ingestion errors, and to open the Source Report for a deeper look at ingestion trends. This page describes each column, the source statuses you can see, the actions available from the row menu, the column-visibility control, and the four charts that make up the Source Report.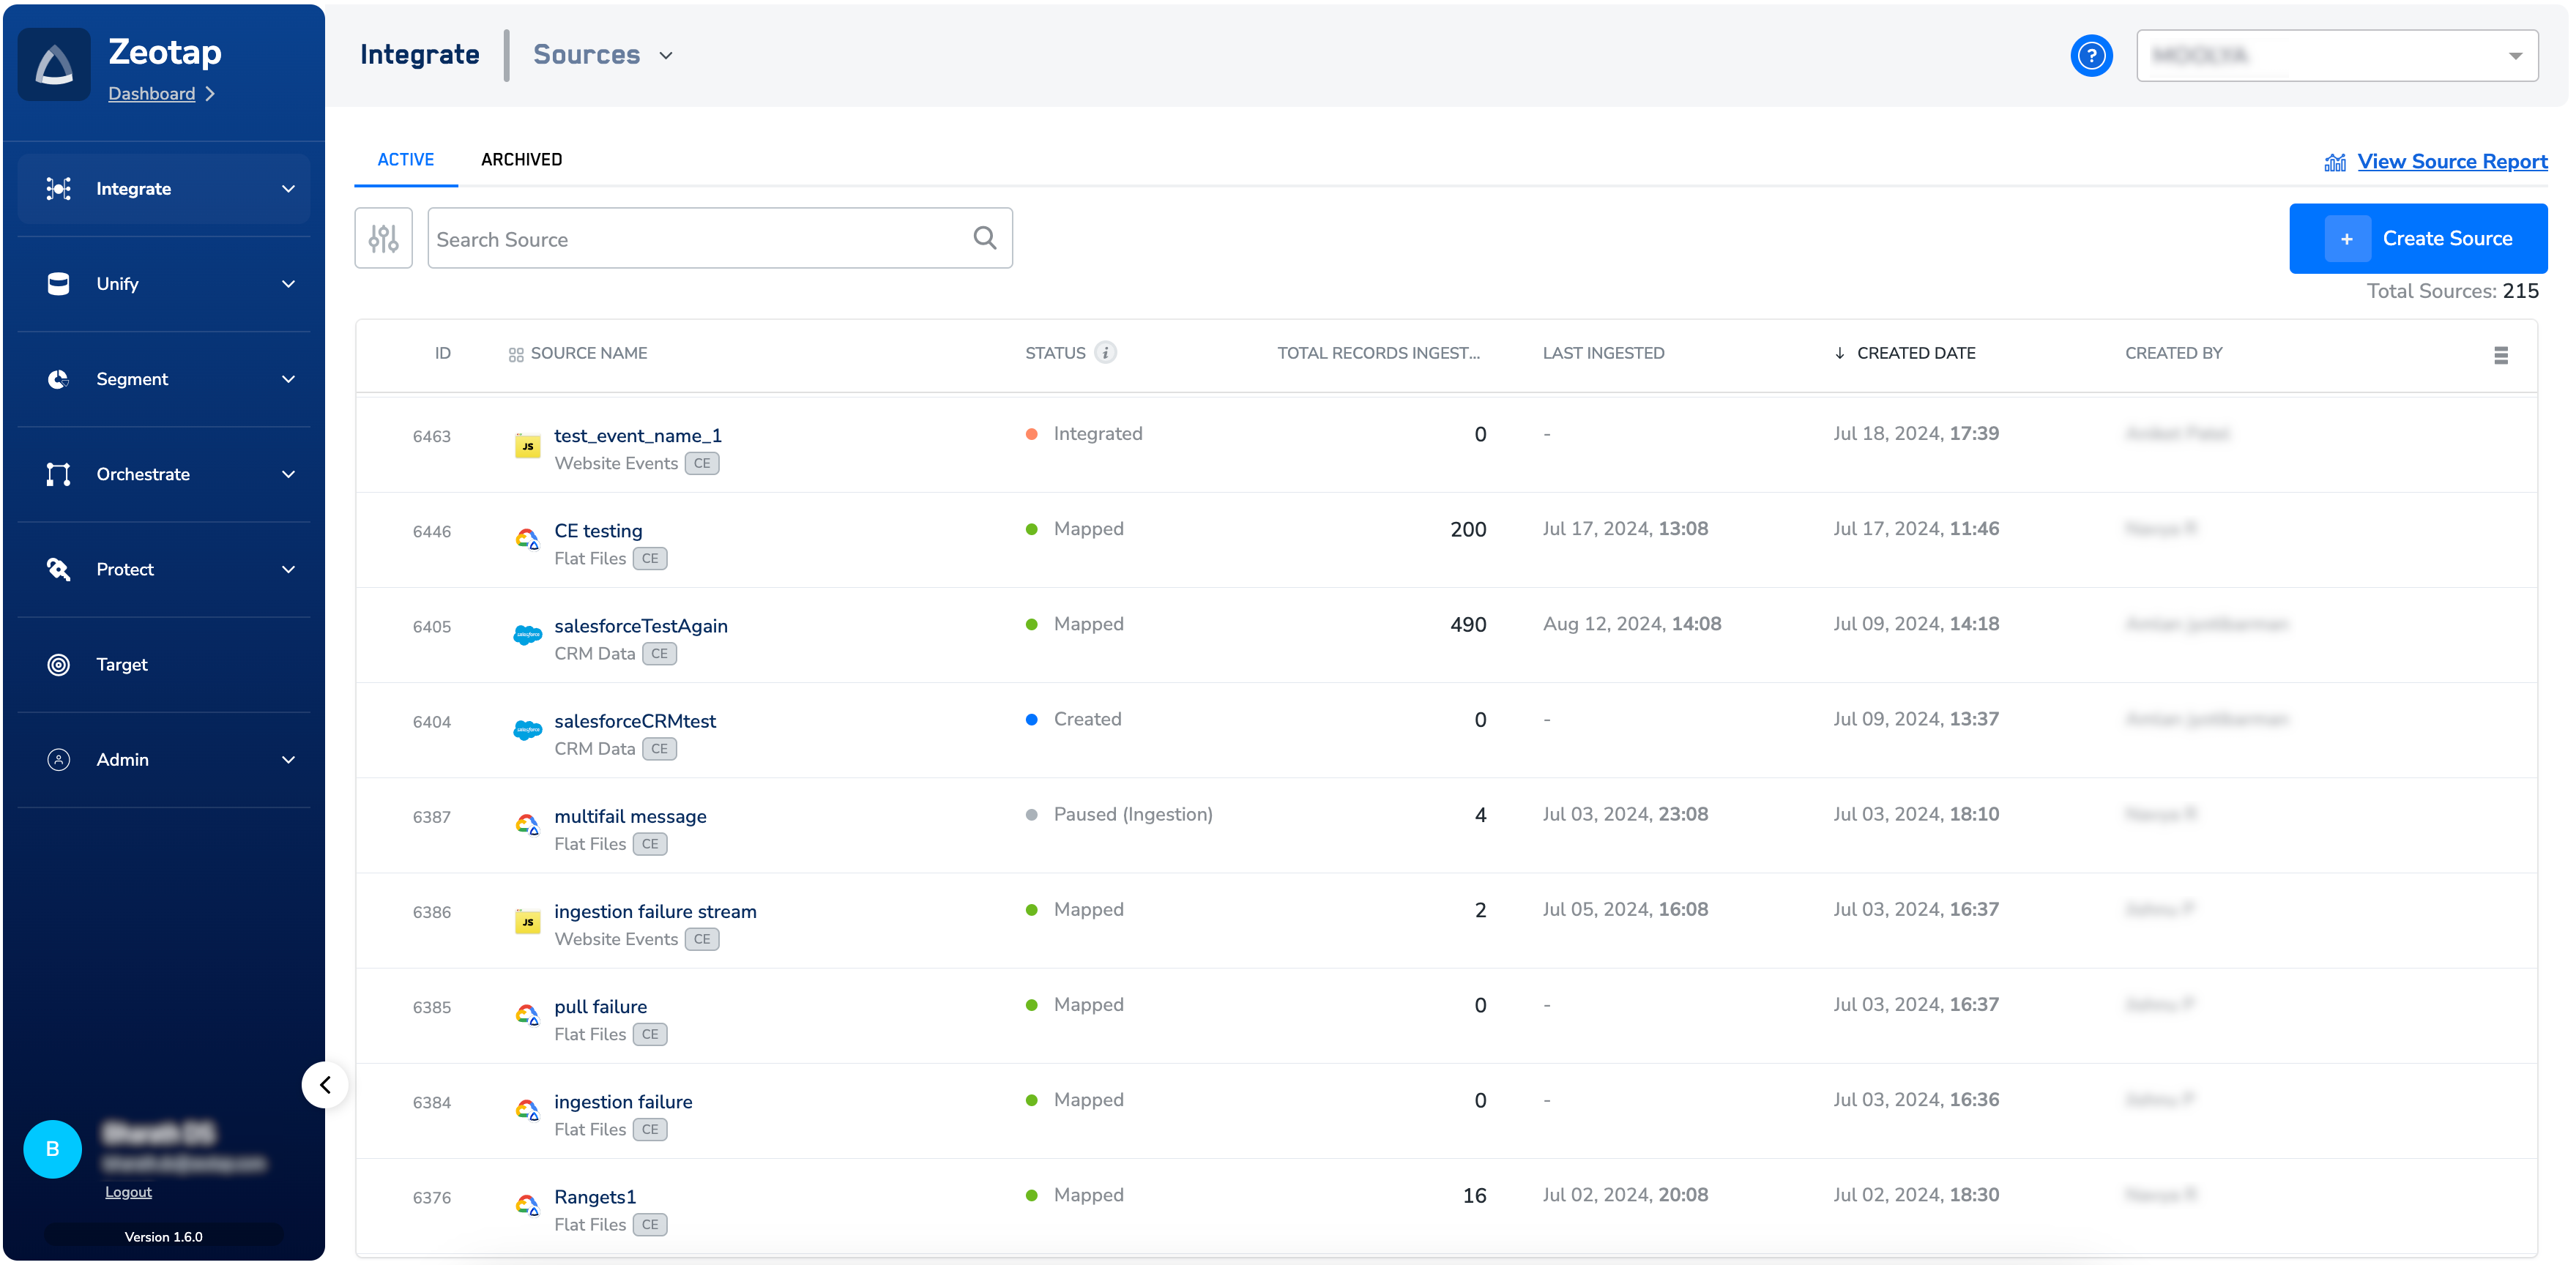
Prerequisites
To read the Source Listing page you need access to the Integrate module in the Zeotap CDP App and at least one source created in your account. If no sources exist yet, create one first — for example, a Snowflake source, a Databricks source, a Batch source, or a Web Pixel, Web iFrame, or App Pixel source.
Read the columns on the Source Listing page
The Source Listing page displays the following columns for every source in your account.Status reference
The Status column shows one of the following values.Interpret the Total Records pie chart
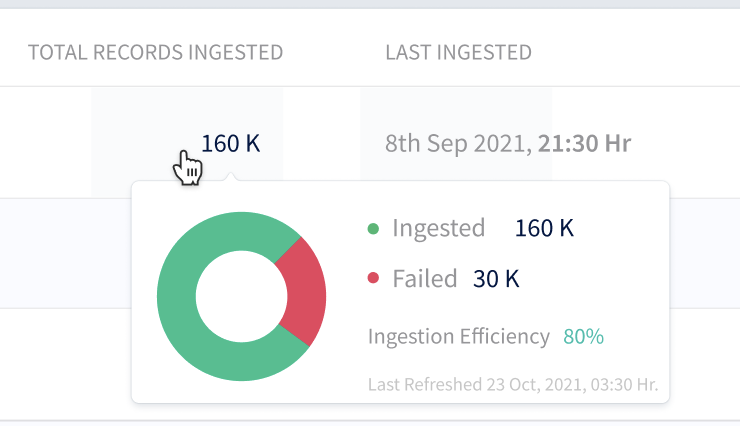
Hovering the number in the Total Records Ingested column opens a pie-chart pop-up with four values:- Ingested — the total number of records ingested and available for activation.
- Failed — the records that failed to ingest during ingestion.
- Ingestion Efficiency — the percentage of ingested records against total records received.
- Last Refreshed Date — the date and time the values in the pop-up were last updated.
Actions available from the row menu
Clicking the three dots at the end of a source row opens a drop-down. The actions offered depend on the source’s status and source type: pause, rename, archive, edit mapping, pause data collection, pause data ingestion, resume data collection, and resume data ingestion.- Pausing both data ingestion and data collection moves the source to the
Pausedstate. - Saving the mapping for a paused source moves the source to the
Mappedstate.
Open the Source Report
The View Source Report button in the source row opens a report that shows the data journey and record-status information for that source in one place, through four charts. The report dashboard refreshes every 8 hours.Chart 1 — Source Ingestion Trend
Visualises cumulative event data over time. The y-axis is the cumulative count of ingested records; the x-axis is the start of the week. The chart supports filtering by the last 7 days, 30 days, or 90 days, and the filtered view can be downloaded as CSV.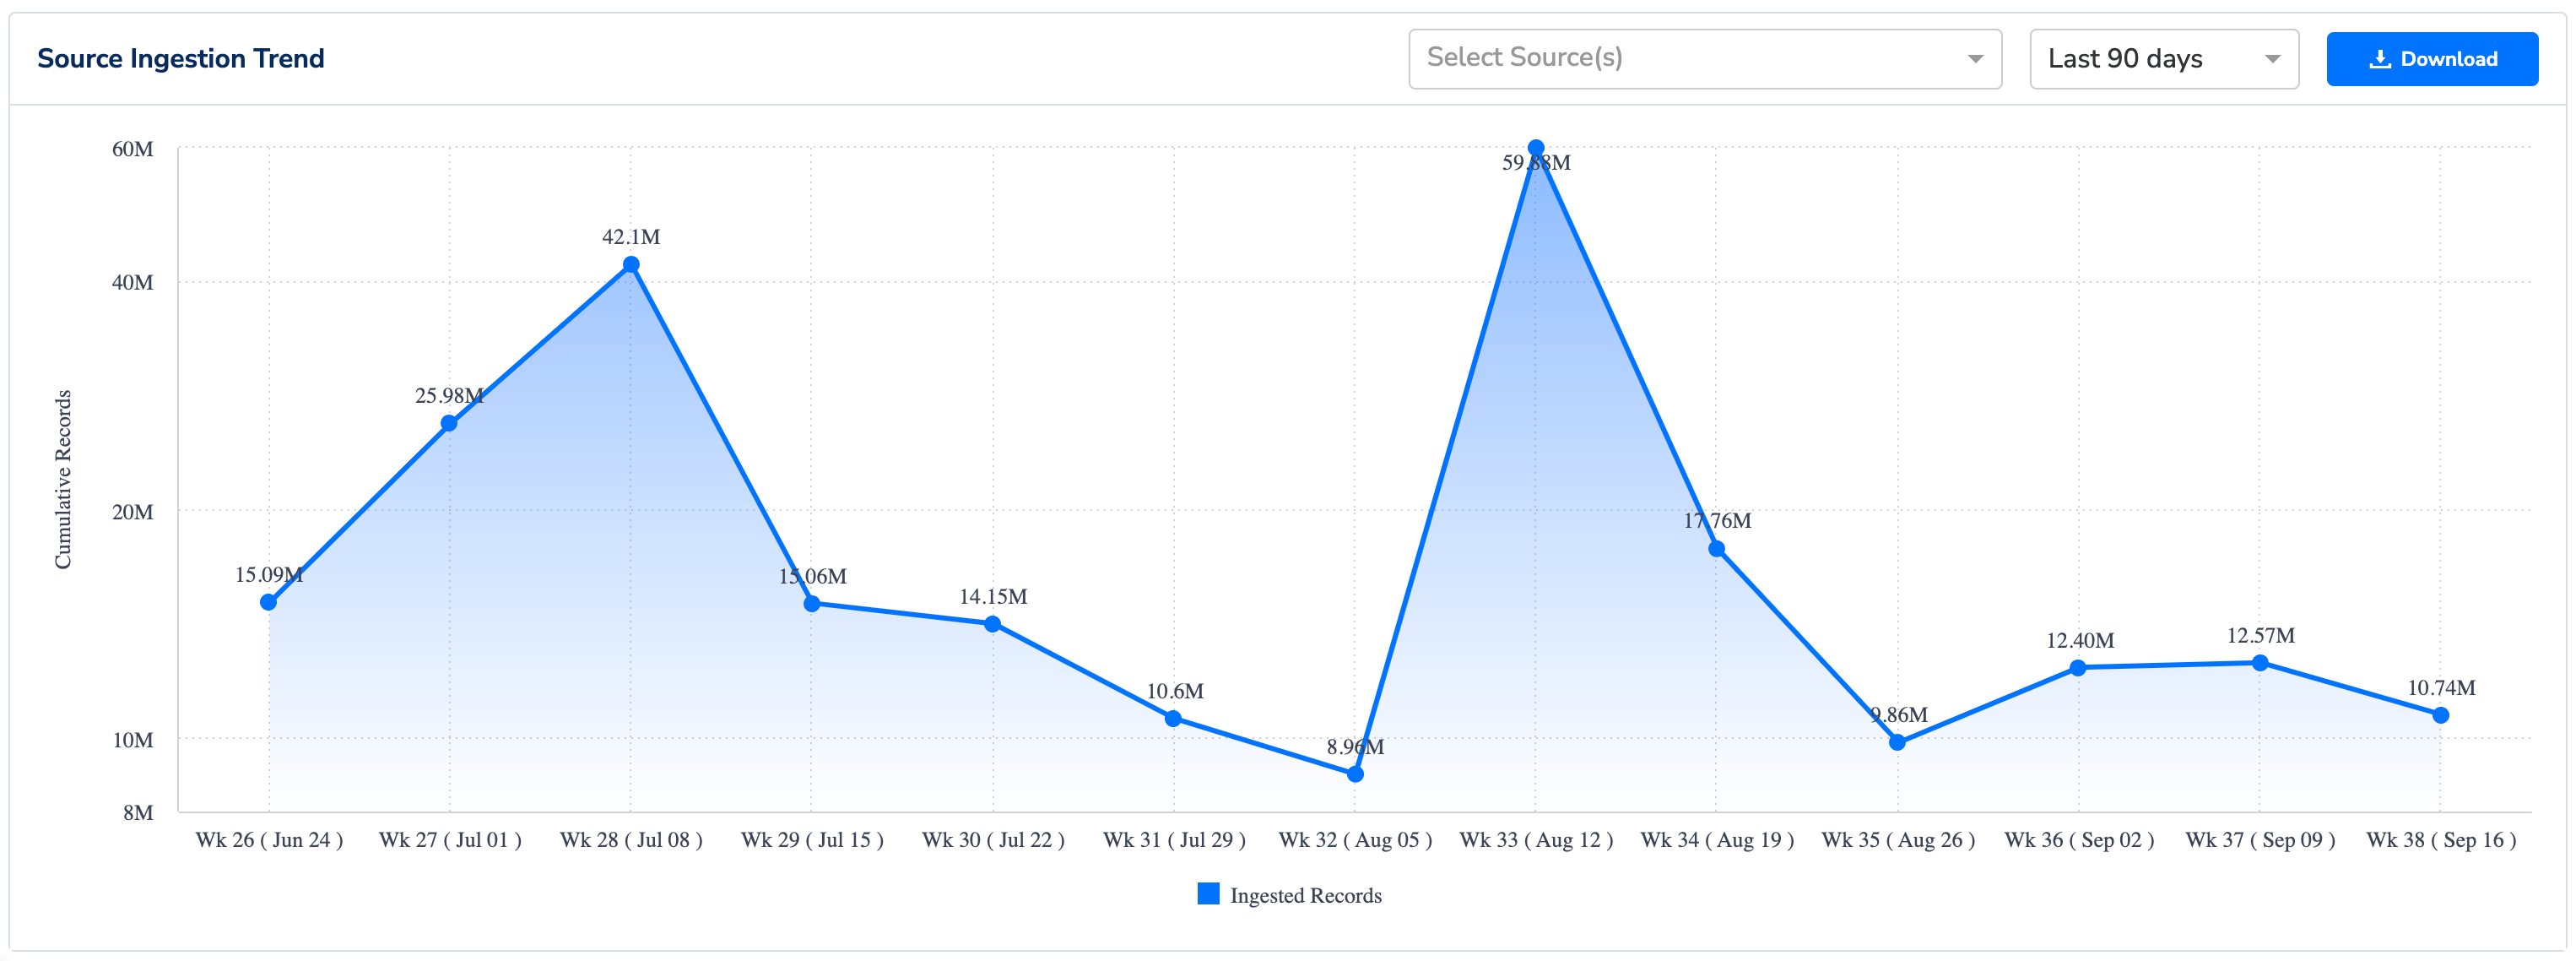
Chart 2 — Batch vs Streaming Ingestion Trend
Displays the count of ingested events over time, split between Batch Sources and Streaming Sources. The y-axis is the number of ingested events; the x-axis is the date.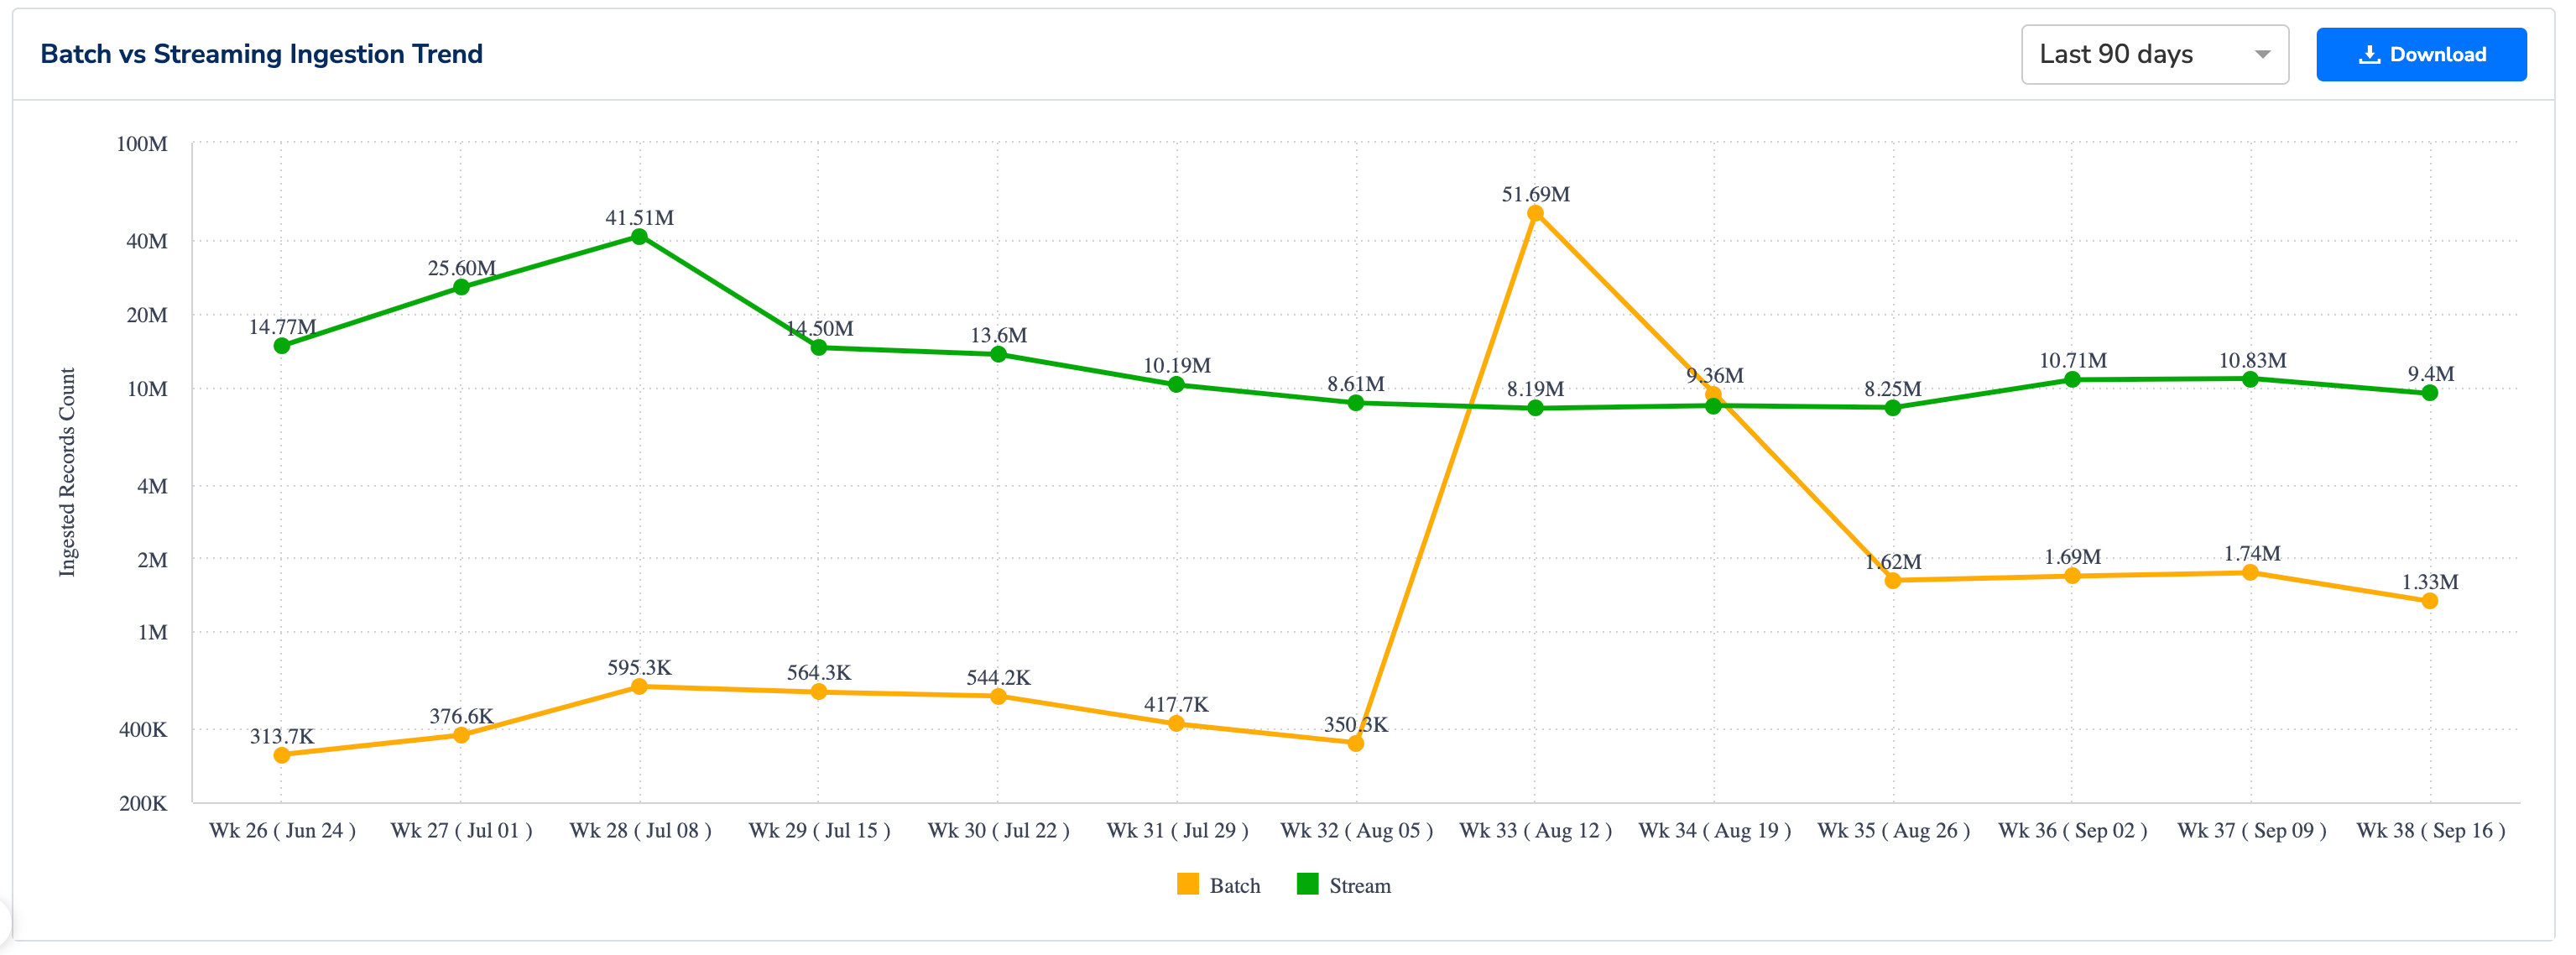
Chart 3 — Top Sources Ingestion Trend
Displays the number of ingested events over time for your top data sources, ranked by cumulative ingestion records. Filter the chart to view the top 5, top 10, or top 15 sources.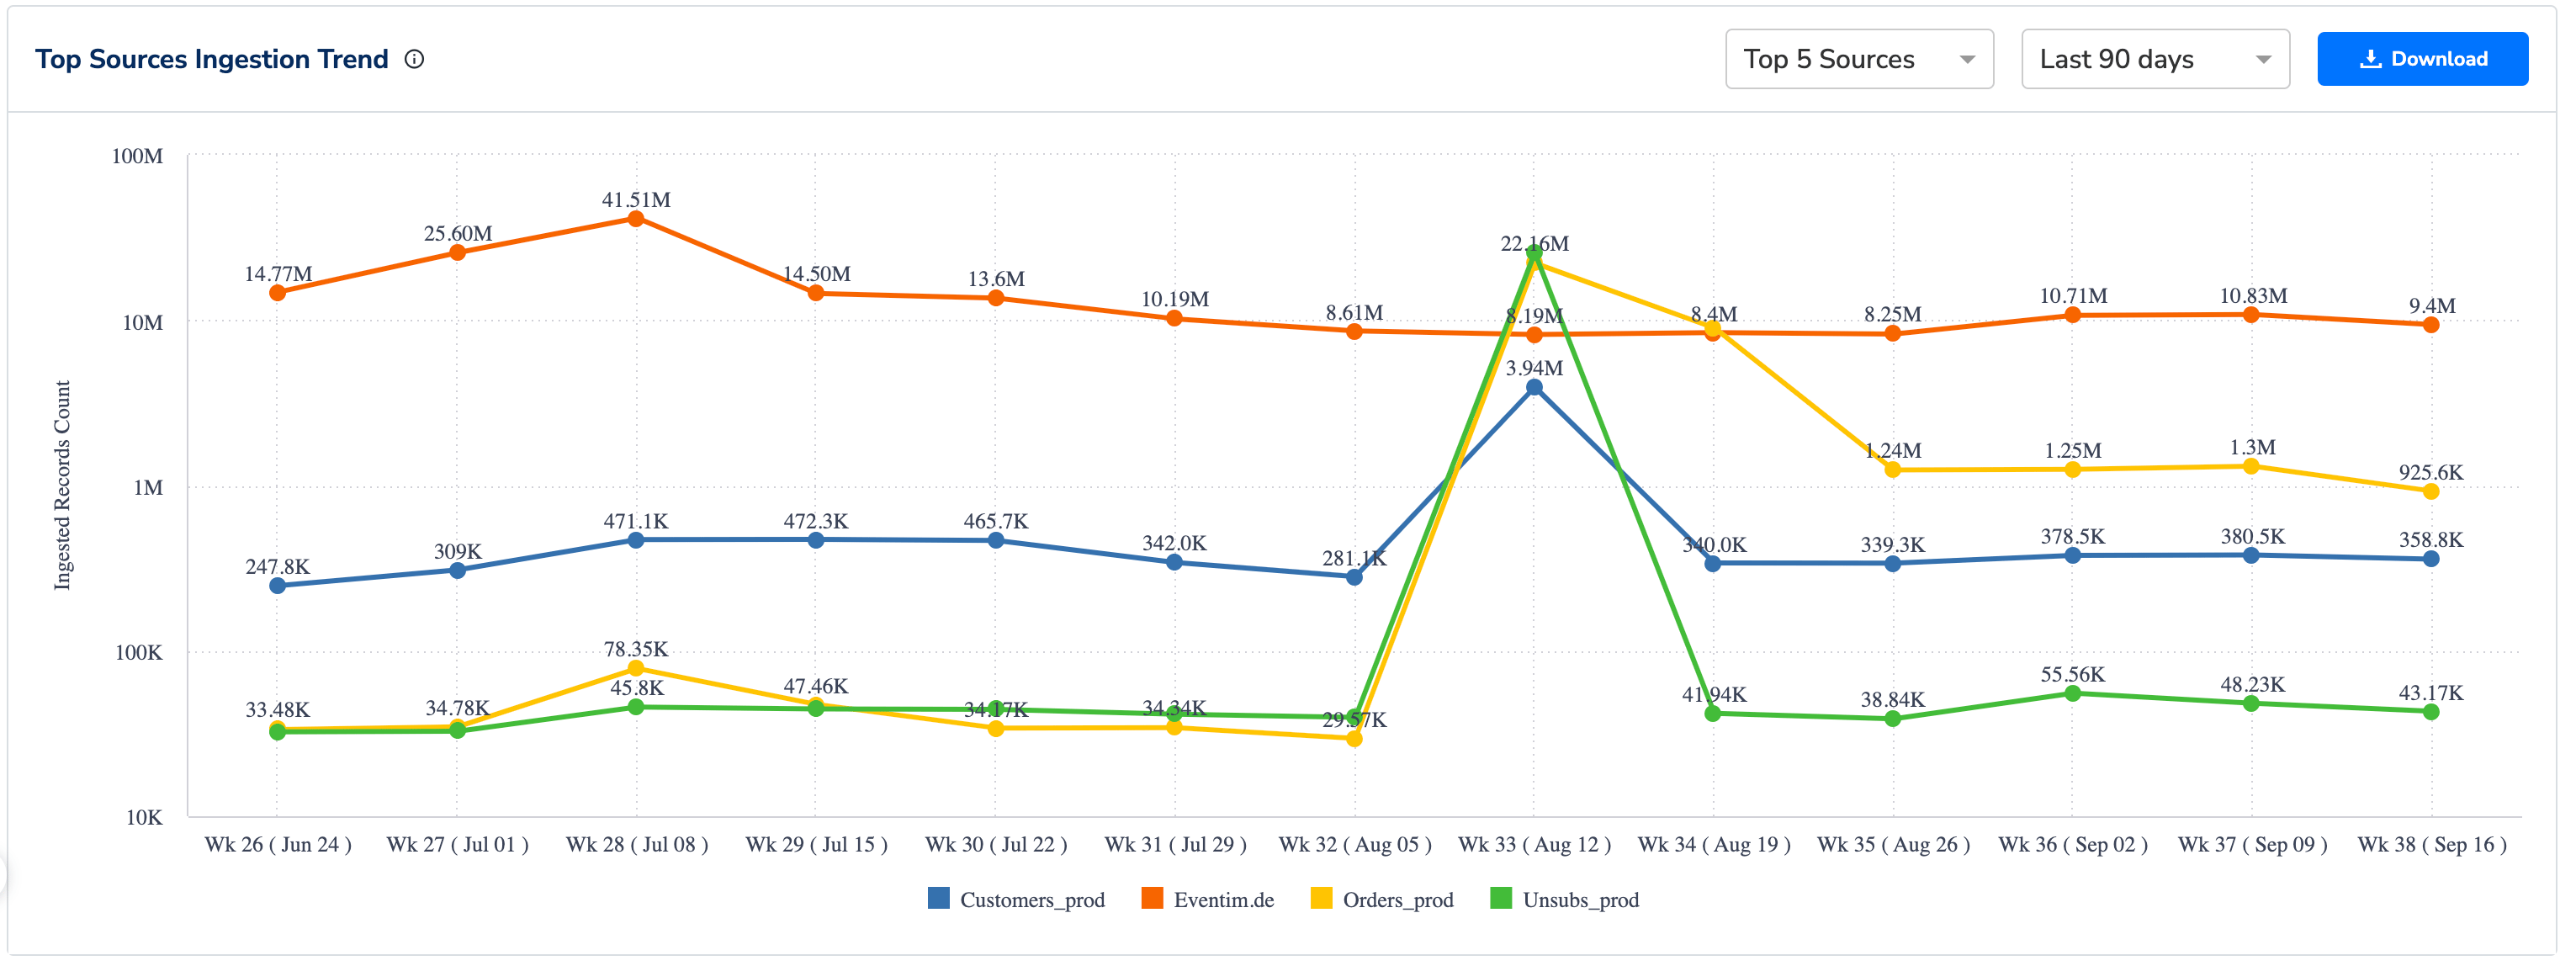
Chart 4 — Batch Sources Report
A tabular report on batch sources with the following columns: Date (the date the batch was received), Source Name, Source Type (for example, Zeotap Google Cloud, SFTP, JS, Web pixel), File Name (the name of the file ingested), Status (the current status of the batch), Received Records (the number of records received from the source), and Ingested Records (the number of records successfully ingested).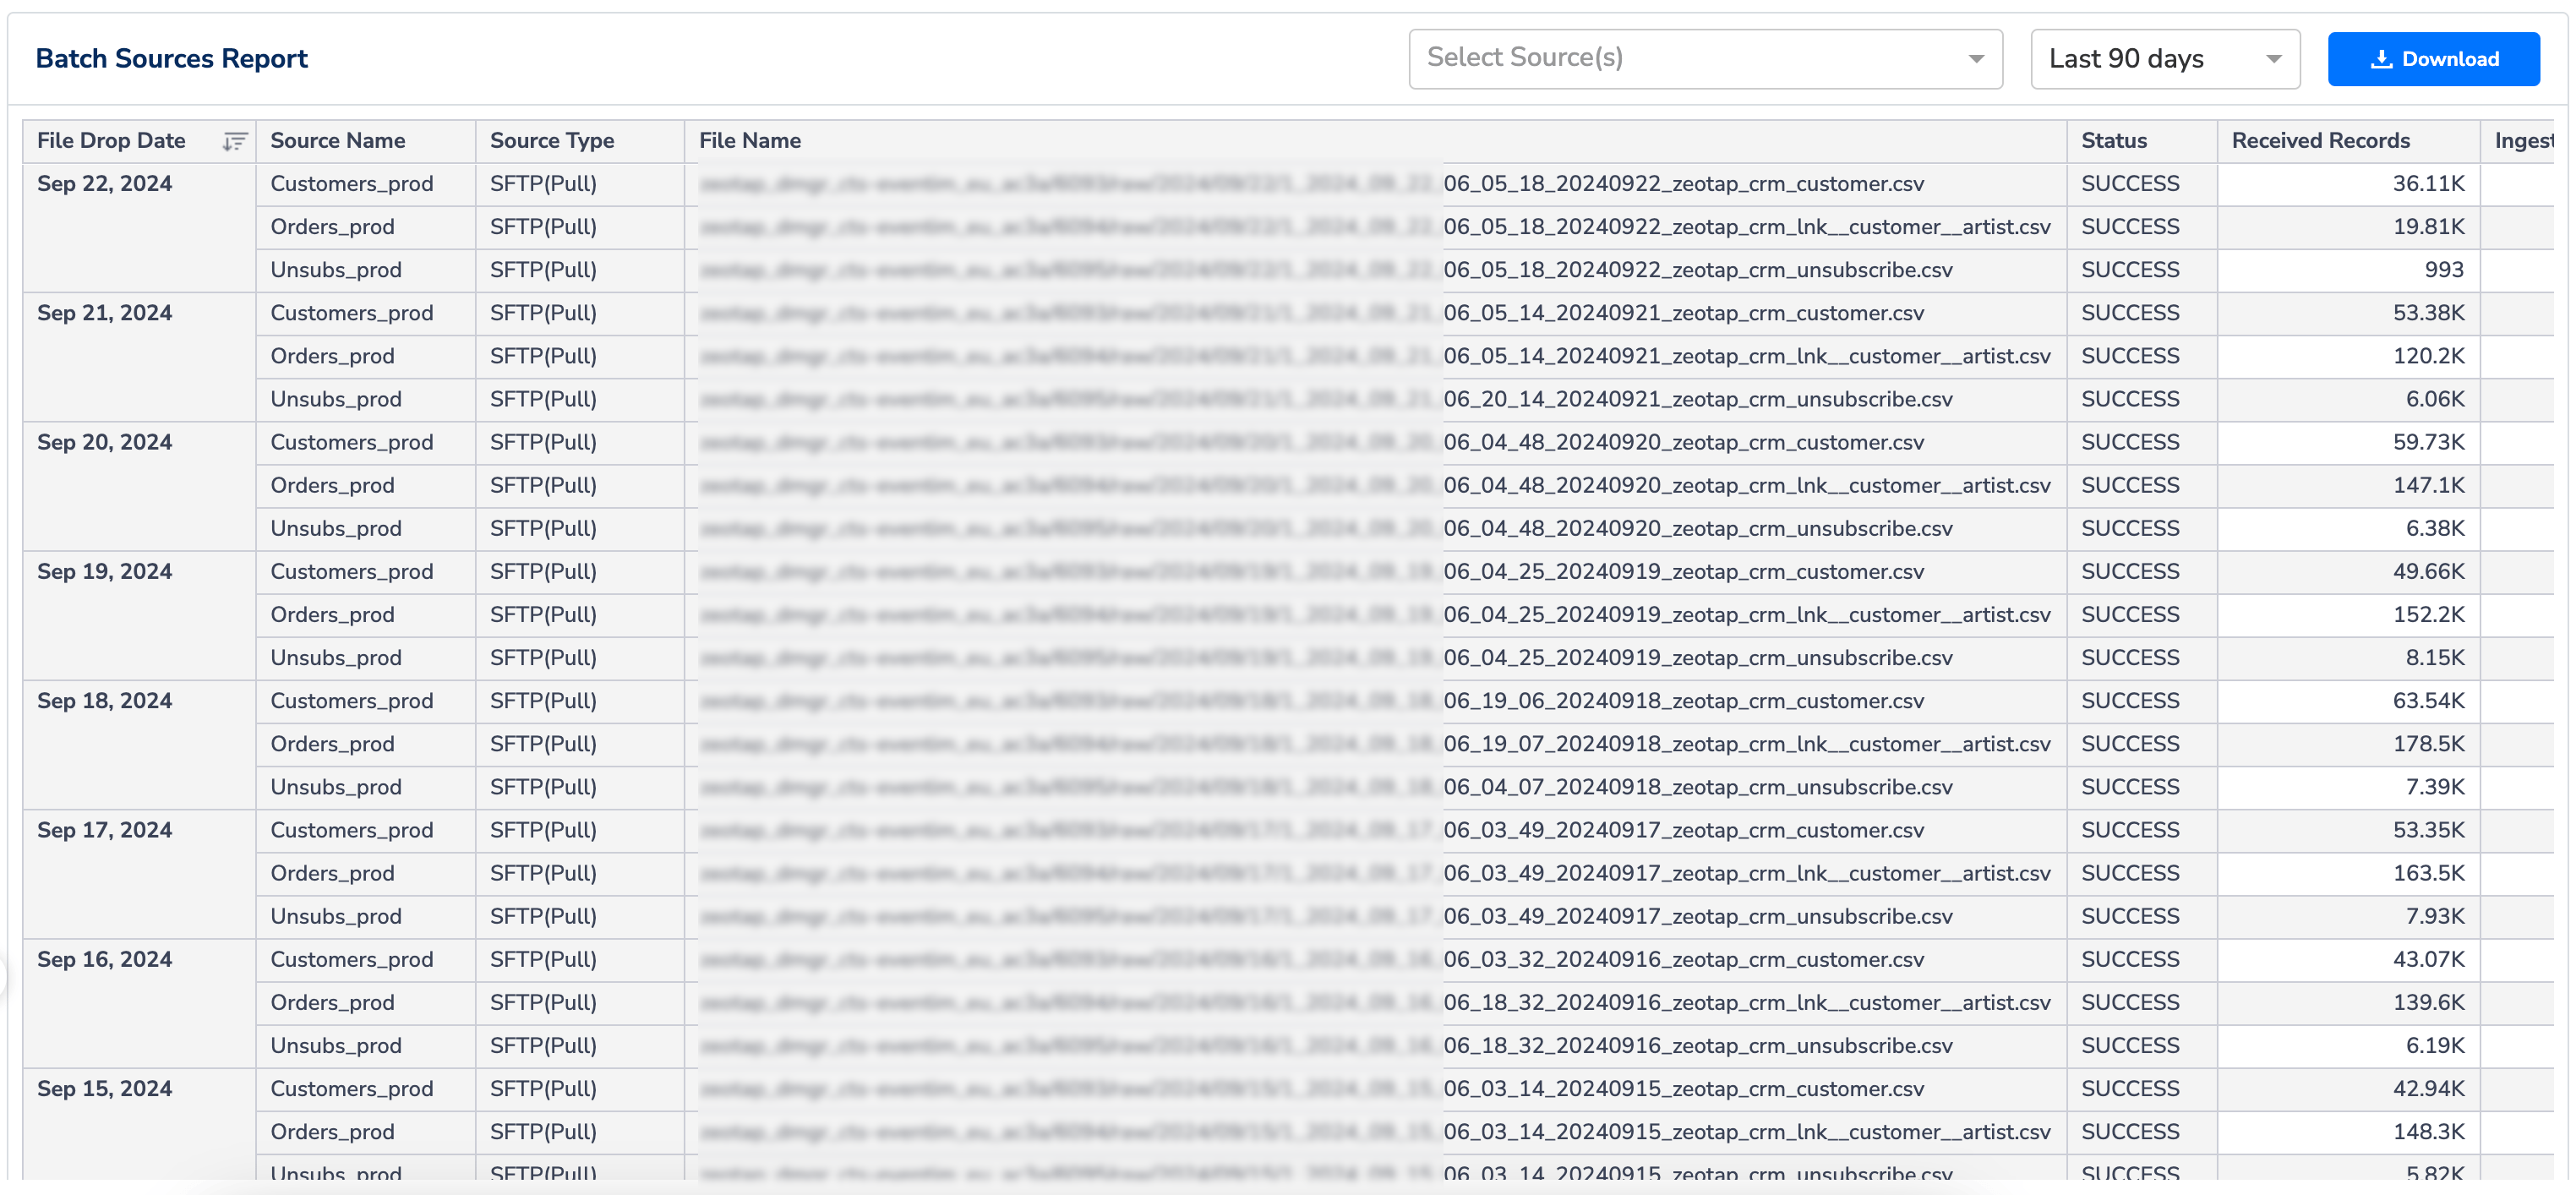
Choose which columns are visible
The column-selection drop-down above the table lets you show or hide columns. The following four columns are mandatory and cannot be deselected: ID, Source Name, Status, and Total Records Ingested. Every other column can be toggled on or off.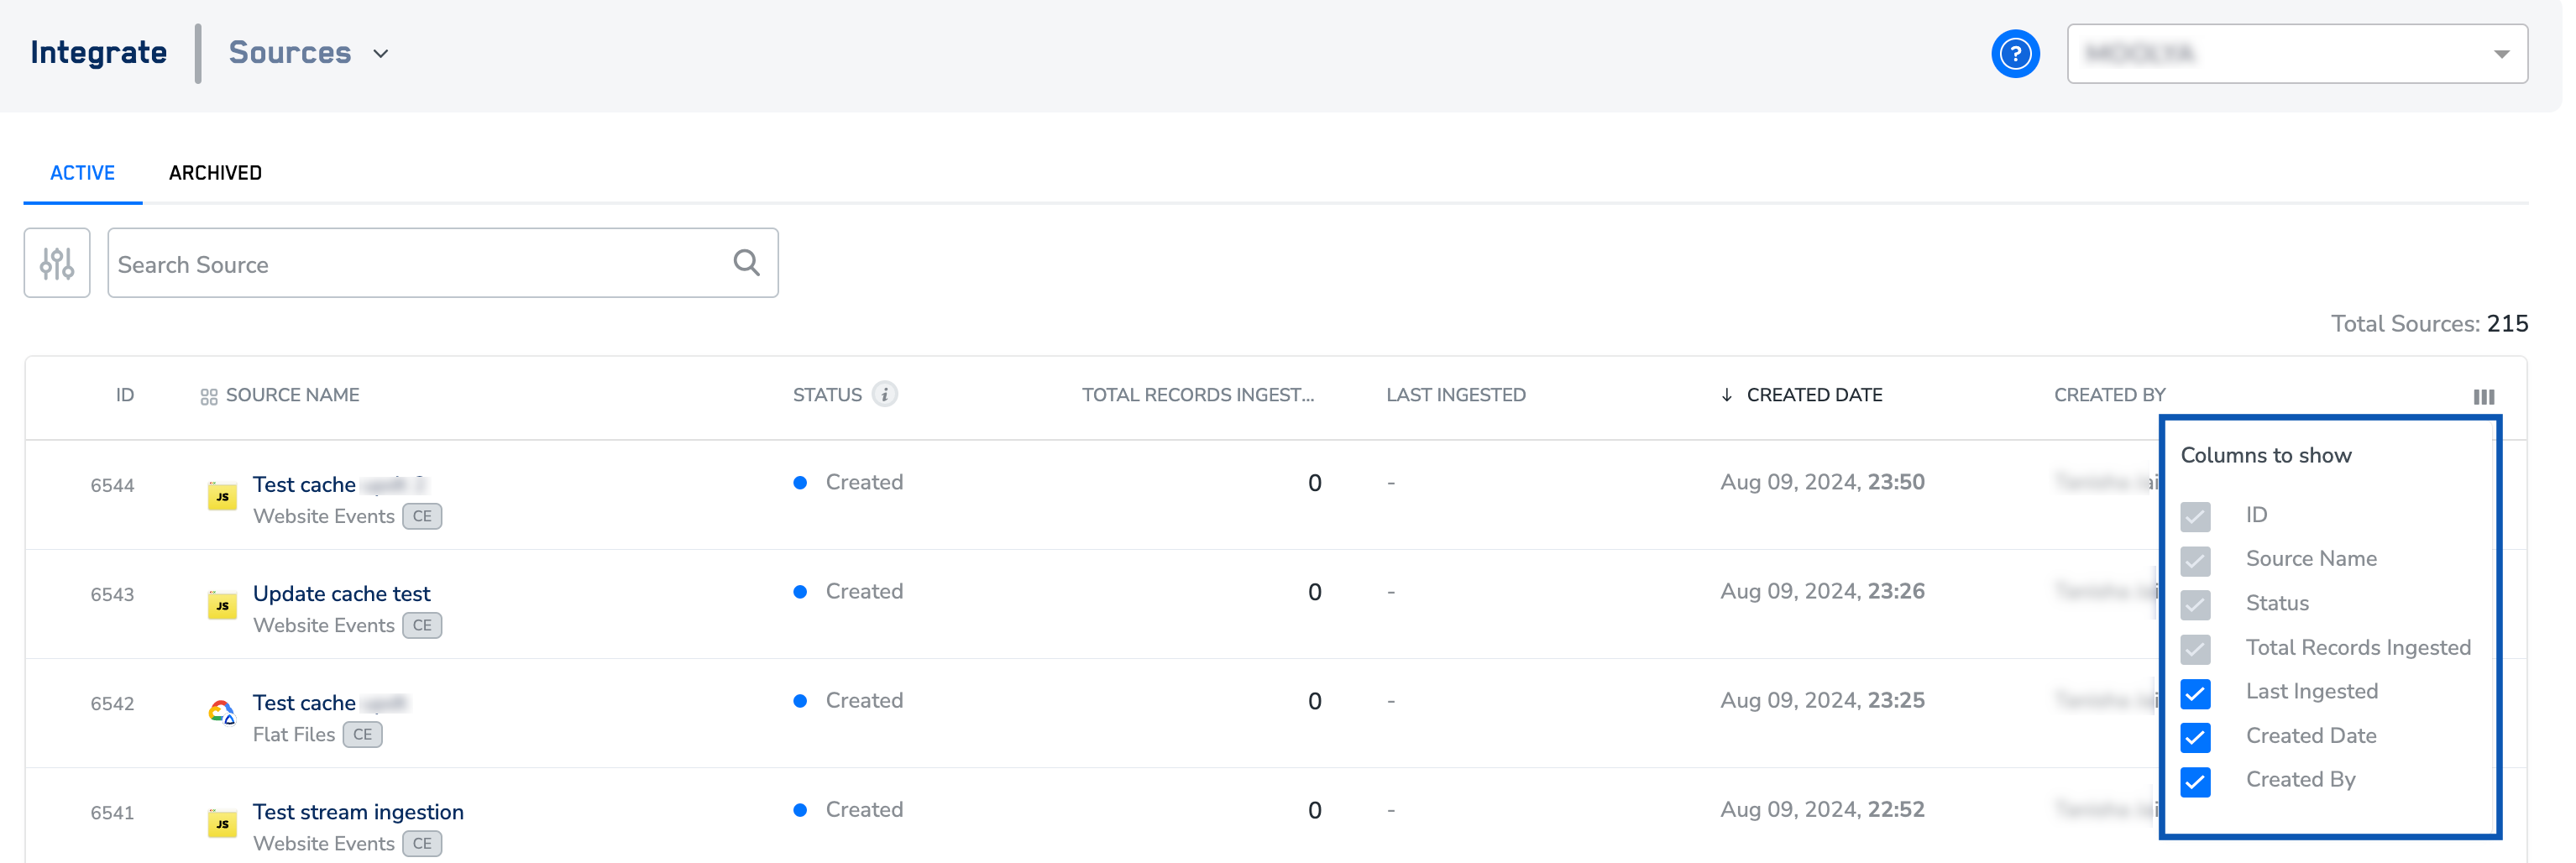
Verify you are reading the page correctly
You are reading the Source Listing correctly when:- The Status column matches the source’s stage — a source you just created shows
Created, a source with data flowing but no data collection showsIntegrated, and a source with at least one data collection showsMapped. - Hovering Total Records Ingested opens the pie chart with Ingested, Failed, Ingestion Efficiency, and Last Refreshed Date populated.
- The Last Ingested timestamp advances after each successful sync.
- The Source Report opens from View Source Report and its Last Refreshed Date is within the last 8 hours.
Why this happens
Use the table below to map a signal on the Source Listing page to what it means and where to look for more detail.When to contact support
Contact your Zeotap customer success representative, or the Zeotap support team at support@zeotap.com, when:- An alert icon persists on a source row after you have deleted and replaced the erroneous flat files.
- The Last Ingested timestamp has not advanced across two successive sync intervals for a source in
IntegratedorMappedstate. - The Ingestion Efficiency value stays below 100% and you cannot identify the failed records from the source’s Preview Data tab.
- The Source Report dashboard has not refreshed for more than 8 hours.
Next steps
- Explore Archived Source →
- Explore Create a Snowflake Source and Load Data →
- Explore Set Up a Databricks Source →
- Explore Create a Batch Source →
- Explore Create a Web Pixel/Web iFrame/App Pixel Source →
FAQ
Why does an alert icon still appear on my source row?
Why does an alert icon still appear on my source row?
The alert icon remains until every erroneous record ingested in the last 90 days is resolved. For flat-file sources, that means deleting the erroneous files and replacing them with corrected files. If the icon persists after you have replaced the files, contact support with the source ID and the timestamp of the replacement upload.
How current are the numbers in the Source Report charts?
How current are the numbers in the Source Report charts?
The Source Report dashboard refreshes every 8 hours. The Last Refreshed Date shown in the Total Records pie-chart pop-up tells you exactly when the values on the row itself were last updated.
Can I hide the ID or Status columns from the listing?
Can I hide the ID or Status columns from the listing?
No. ID, Source Name, Status, and Total Records Ingested are mandatory and cannot be removed from the column selector. Every other column can be toggled on or off.
What is the difference between Paused, Paused (Collection), and Paused (Ingestion)?
What is the difference between Paused, Paused (Collection), and Paused (Ingestion)?
Paused (Collection) stops data being collected at the source and invalidates the write key. Paused (Ingestion) stops data being ingested into Zeotap CDP but leaves collection intact. Paused means both are stopped — pausing both from the row menu is what moves a source to the Paused state.