> ## Documentation Index
> Fetch the complete documentation index at: https://docs.zeotap.com/llms.txt
> Use this file to discover all available pages before exploring further.
# Journey Traces
> Per-user debugging and event tracking for Journey workflows in Zeotap CDP.
## 1. Introduction to Journey Traces
Journey Traces is a powerful debugging and event tracking tool within the Zeotap CDP Orchestrate module. It provides granular, per-user visibility into how individual events flow through a journey workflow — from the initial input event, through each node in the journey canvas, to the final output event sent to each destination.
Unlike aggregate execution views that show summary counts (e.g., "500 succeeded, 12 failed"), Journey Traces lets you drill down to a **single user's journey** and inspect the exact data that was received, how it was transformed, which nodes the user qualified for, and what was ultimately delivered to each destination. This level of detail is essential for diagnosing data transformation issues, conditional routing problems, and destination-specific failures.
**Why This Matters**
In complex multi-branch workflows with multiple destinations, understanding exactly what happened to a specific user is often the difference between a 5-minute fix and a multi-hour investigation. Journey Traces transforms debugging from guesswork into a precise, data-driven process.
### 1.1 Key Capabilities
* **Per-User Event Tracing** — Search for any user by UUID and see their complete journey path, including which nodes they qualified for.
* **Input Event Inspection** — View the raw JSON payload of the event that triggered the journey for a specific user, including all customer attributes and event metadata.
* **Output Event Inspection** — View the transformed output event sent to each destination, with a dropdown to switch between destination nodes.
* **Visual Path Highlighting** — On the journey canvas, green checkmarks appear on every node the user qualified for, providing an instant visual map of the user's journey path.
* **Customer 360 Integration** — A "View Profile" link connects directly from a trace record to the user's full Customer 360 profile in the Protect module.
* **JSON & Raw Toggle** — Switch between formatted JSON and raw data views for both input and output events, making it easy to copy data for debugging.
* **Time-Range Filtering** — Filter traces by date range (e.g., "Last 7 Days") to focus on recent executions.
### 1.2 Target Audience
| Role | Primary Use Case |
| --------------------- | ------------------------------------------------------------------------------------- |
| Integration Engineers | Debug destination-specific data transformation issues, verify payload correctness |
| Data Engineers | Inspect raw event data, verify field mappings, trace data lineage through the journey |
| Marketing Operations | Verify specific users are flowing through the correct journey branches |
| Customer Success | Investigate individual customer activation issues reported by clients |
| QA / Testing | Validate end-to-end journey behavior with specific test users |
***
## 2. Accessing the Journeys Dashboard
The starting point for Journey Traces is the Journeys Dashboard within the Orchestrate module. From here, you select the specific journey workflow you want to debug.
From the Zeotap CDP main navigation, select **Orchestrate** from the left sidebar, then click the **Journeys** tab. The dashboard displays all workflows with their status, creation date, and destination information.
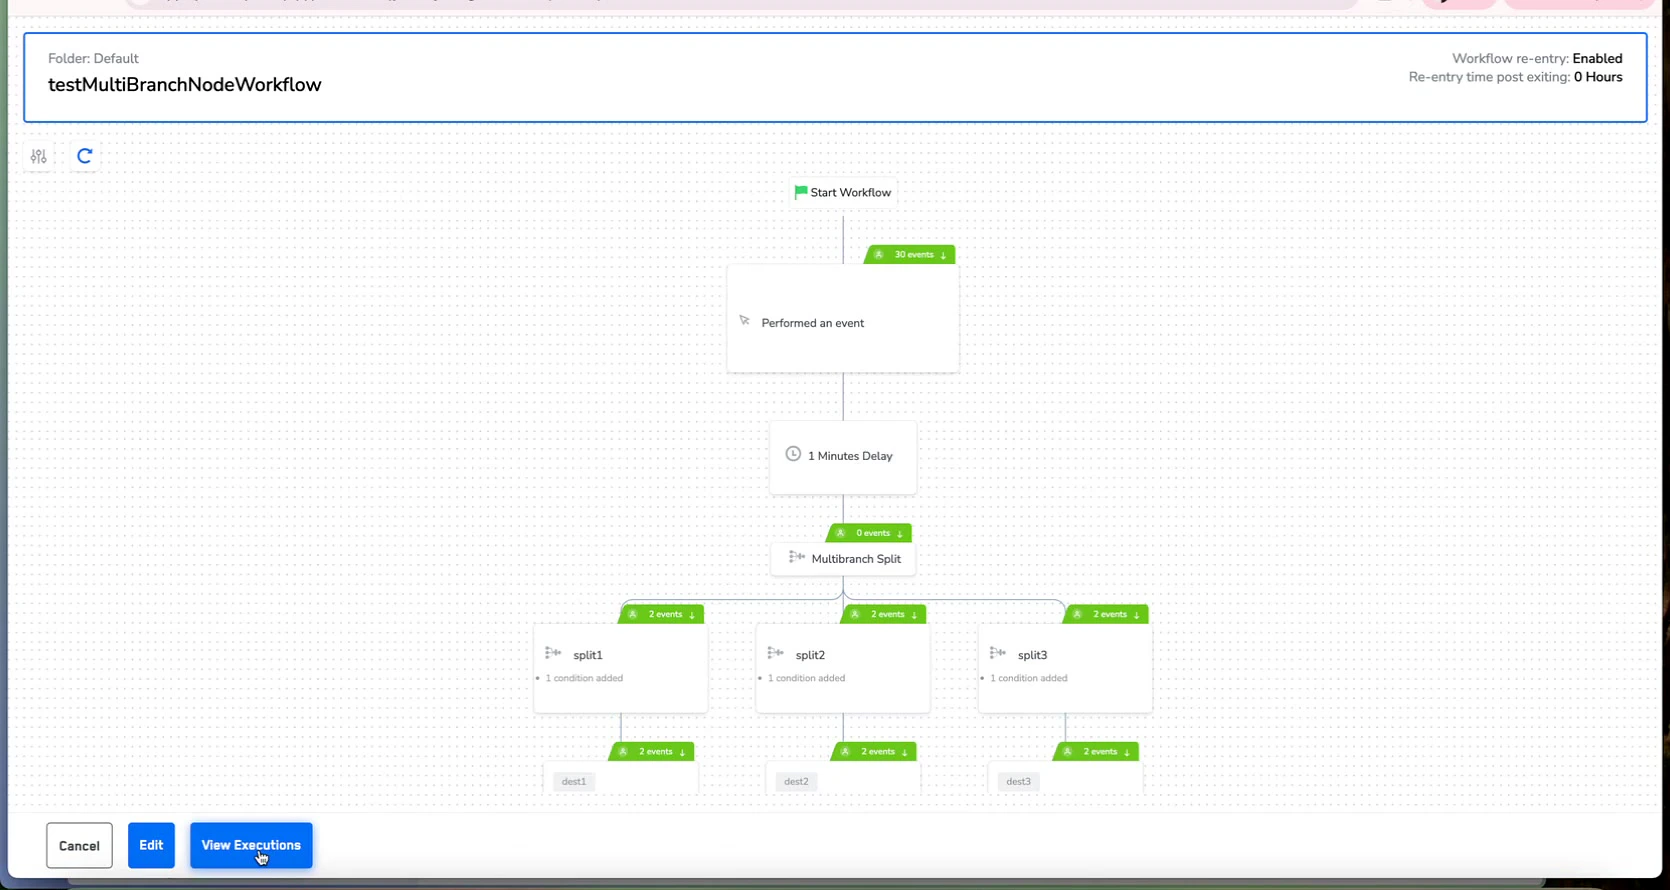
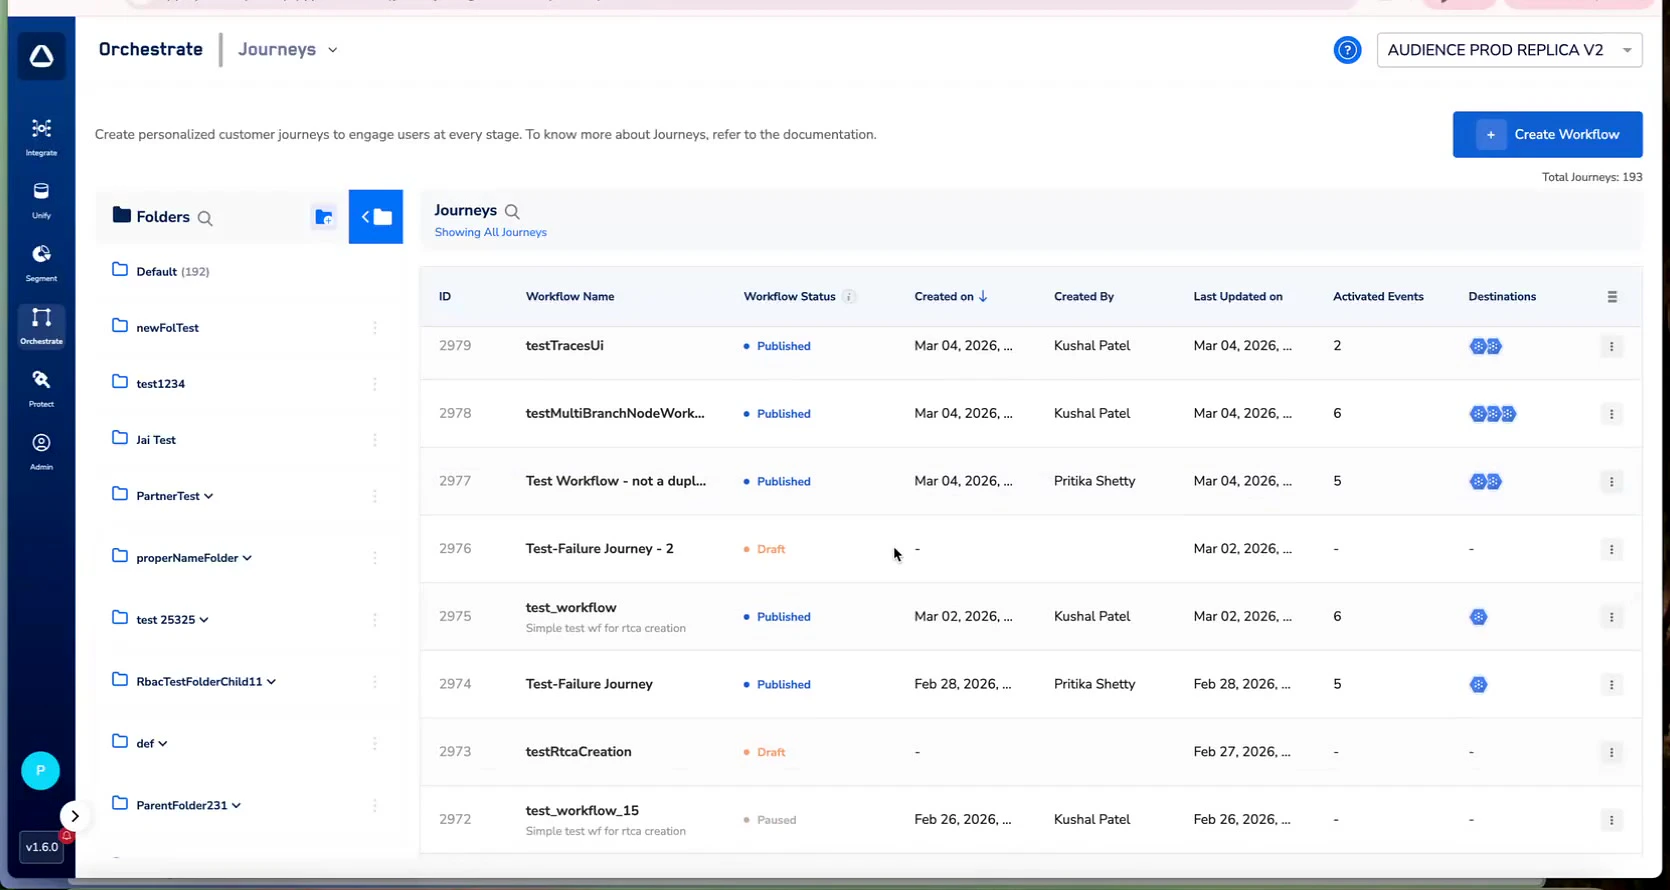 Click on the journey name you want to investigate. In this example, we select **"testMultiBranchNodeWorkflow"** — a complex multi-branch journey with multiple destination nodes. This opens the journey canvas where the Traces panel can be accessed.
 ***
## 3. Opening the Workflow Traces Panel
The Workflow Traces panel is accessible directly from the journey canvas. It provides a searchable list of individual user traces for the selected journey.
### 3.1 Accessing the Traces Panel
From the Journeys Dashboard, click on the workflow name to open the visual canvas. The canvas shows all nodes and their connections.
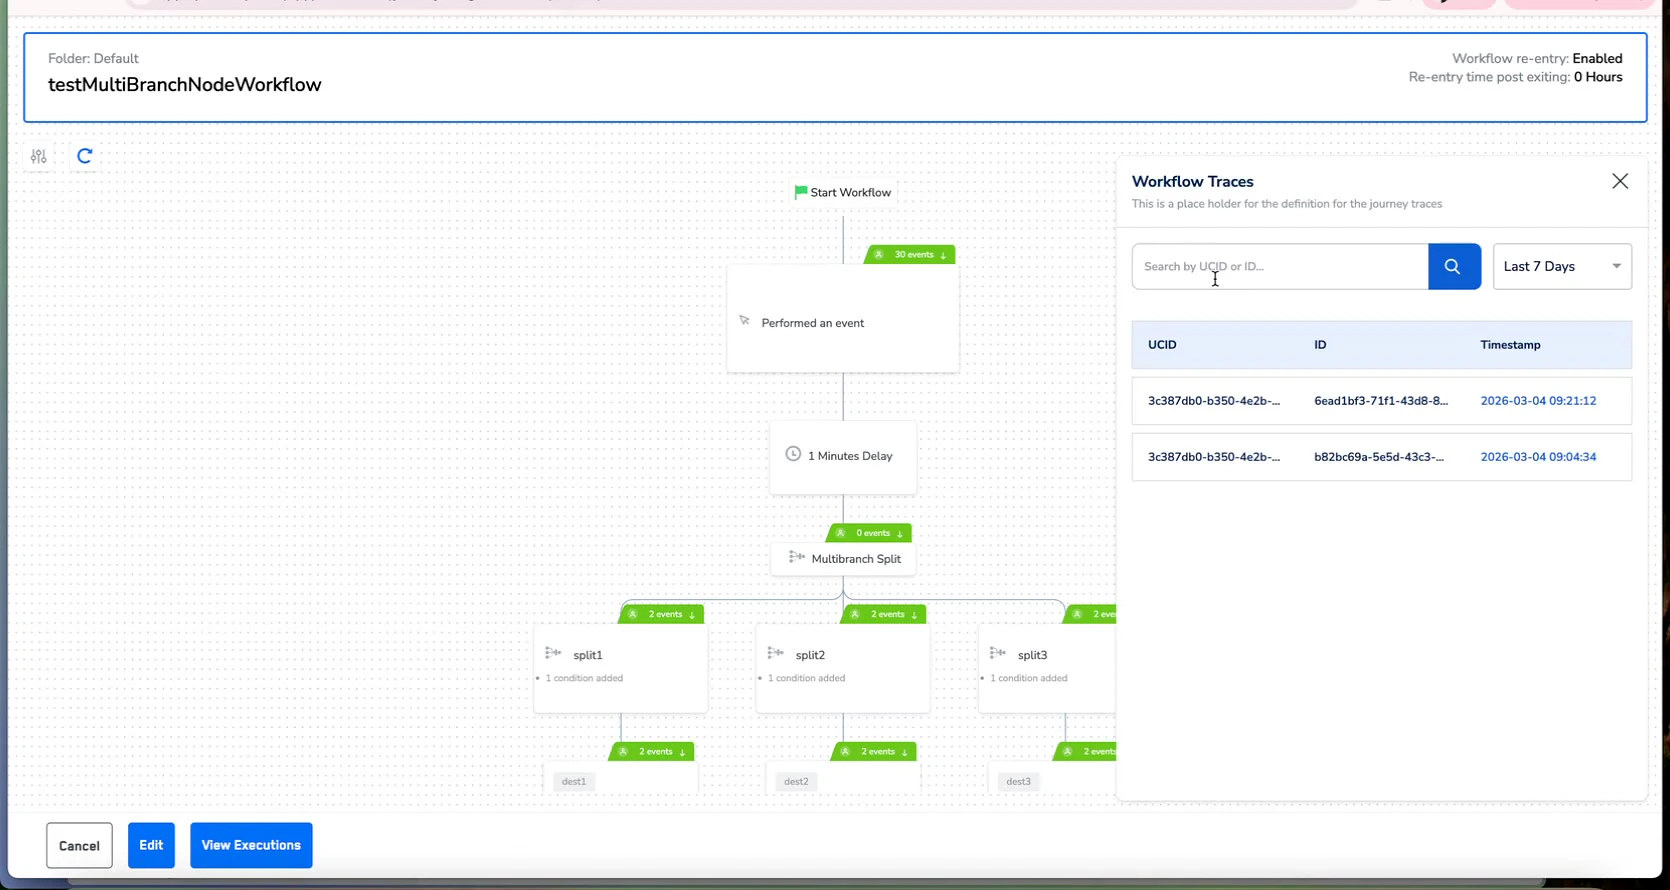
In the journey canvas view, look for the **Workflow Traces** option. This opens a right-side panel that overlays the journey canvas, providing a search interface and a list of recent trace records.
***
## 3. Opening the Workflow Traces Panel
The Workflow Traces panel is accessible directly from the journey canvas. It provides a searchable list of individual user traces for the selected journey.
### 3.1 Accessing the Traces Panel
From the Journeys Dashboard, click on the workflow name to open the visual canvas. The canvas shows all nodes and their connections.
In the journey canvas view, look for the **Workflow Traces** option. This opens a right-side panel that overlays the journey canvas, providing a search interface and a list of recent trace records.
 ### 3.2 Traces Panel Layout
The Workflow Traces panel contains the following key elements:
| Element | Description |
| ---------------- | --------------------------------------------------------------------------------------------------- |
| Search Bar | Search by UUID to find traces for a specific user. Accepts partial or full UUID strings. |
| Time Filter | Dropdown to filter traces by date range (e.g., "Last 7 Days"). Limits results to recent executions. |
| Trace List | A table showing matching traces with columns: UUID, Name/Identifier, and Timestamp. |
| UUID Column | The unique identifier for each trace record, linking to the specific user execution. |
| Timestamp Column | The exact date and time when the trace was recorded (e.g., 2026-03-04 09:08:12). |
**Trace Retention**
Traces are retained based on your account's data retention policy. By default, the "Last 7 Days" filter is applied, but you can adjust this range to search for older traces. For long-running investigations, note the trace UUID for future reference.
***
## 4. Searching & Filtering Traces
The Traces panel provides flexible search capabilities to locate specific user traces within your journey execution history.
### 4.1 Search by UUID
Enter a user's UUID (or partial UUID) into the search bar at the top of the Traces panel. The system performs a real-time search and returns matching trace records. Each result shows the full UUID, the user's name or identifier, and the timestamp of the trace.
### 3.2 Traces Panel Layout
The Workflow Traces panel contains the following key elements:
| Element | Description |
| ---------------- | --------------------------------------------------------------------------------------------------- |
| Search Bar | Search by UUID to find traces for a specific user. Accepts partial or full UUID strings. |
| Time Filter | Dropdown to filter traces by date range (e.g., "Last 7 Days"). Limits results to recent executions. |
| Trace List | A table showing matching traces with columns: UUID, Name/Identifier, and Timestamp. |
| UUID Column | The unique identifier for each trace record, linking to the specific user execution. |
| Timestamp Column | The exact date and time when the trace was recorded (e.g., 2026-03-04 09:08:12). |
**Trace Retention**
Traces are retained based on your account's data retention policy. By default, the "Last 7 Days" filter is applied, but you can adjust this range to search for older traces. For long-running investigations, note the trace UUID for future reference.
***
## 4. Searching & Filtering Traces
The Traces panel provides flexible search capabilities to locate specific user traces within your journey execution history.
### 4.1 Search by UUID
Enter a user's UUID (or partial UUID) into the search bar at the top of the Traces panel. The system performs a real-time search and returns matching trace records. Each result shows the full UUID, the user's name or identifier, and the timestamp of the trace.
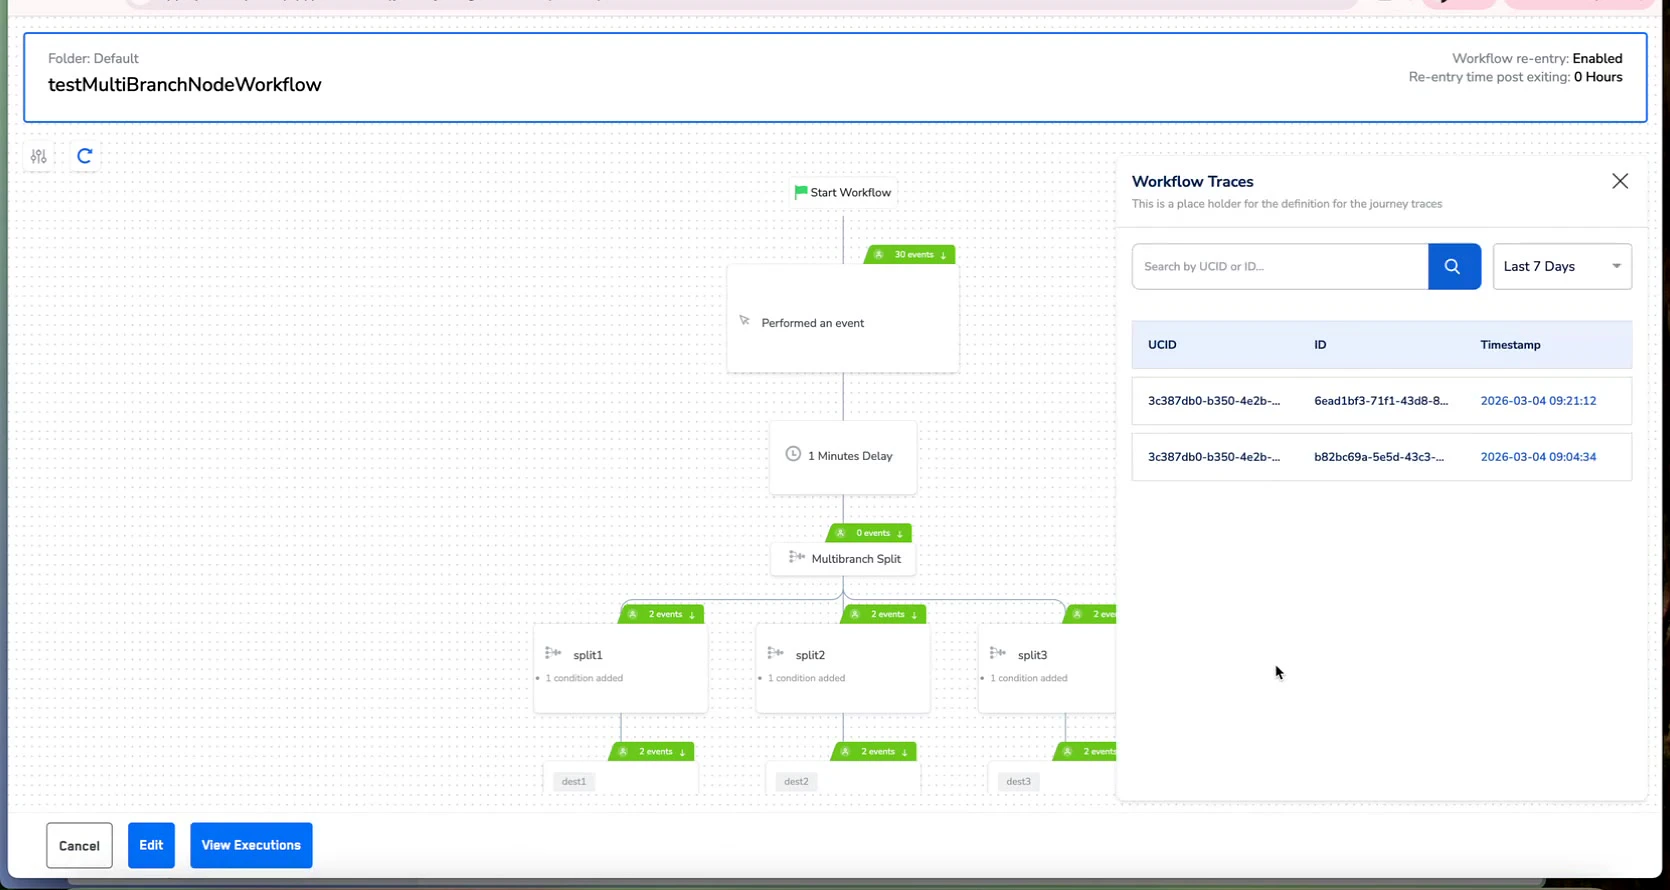 ### 4.2 Time Range Filtering
Use the time filter dropdown (displayed as **"Last 7 Days"** by default) to narrow results to a specific date range. This is particularly useful when:
* You know approximately when an issue occurred
* You want to compare traces across different execution windows
* You need to focus on the most recent executions for active debugging
### 4.3 Interpreting Search Results
Each trace result in the list shows three key pieces of information:
* **UUID** — The unique identifier string for the trace (e.g., `b387Abd1-b090-4a3b-a752...`)
* **Name/Identifier** — A human-readable name or identifier associated with the user
* **Timestamp** — The exact execution timestamp (e.g., 2026-03-04 09:08:12)
***
## 5. Inspecting a Trace Record
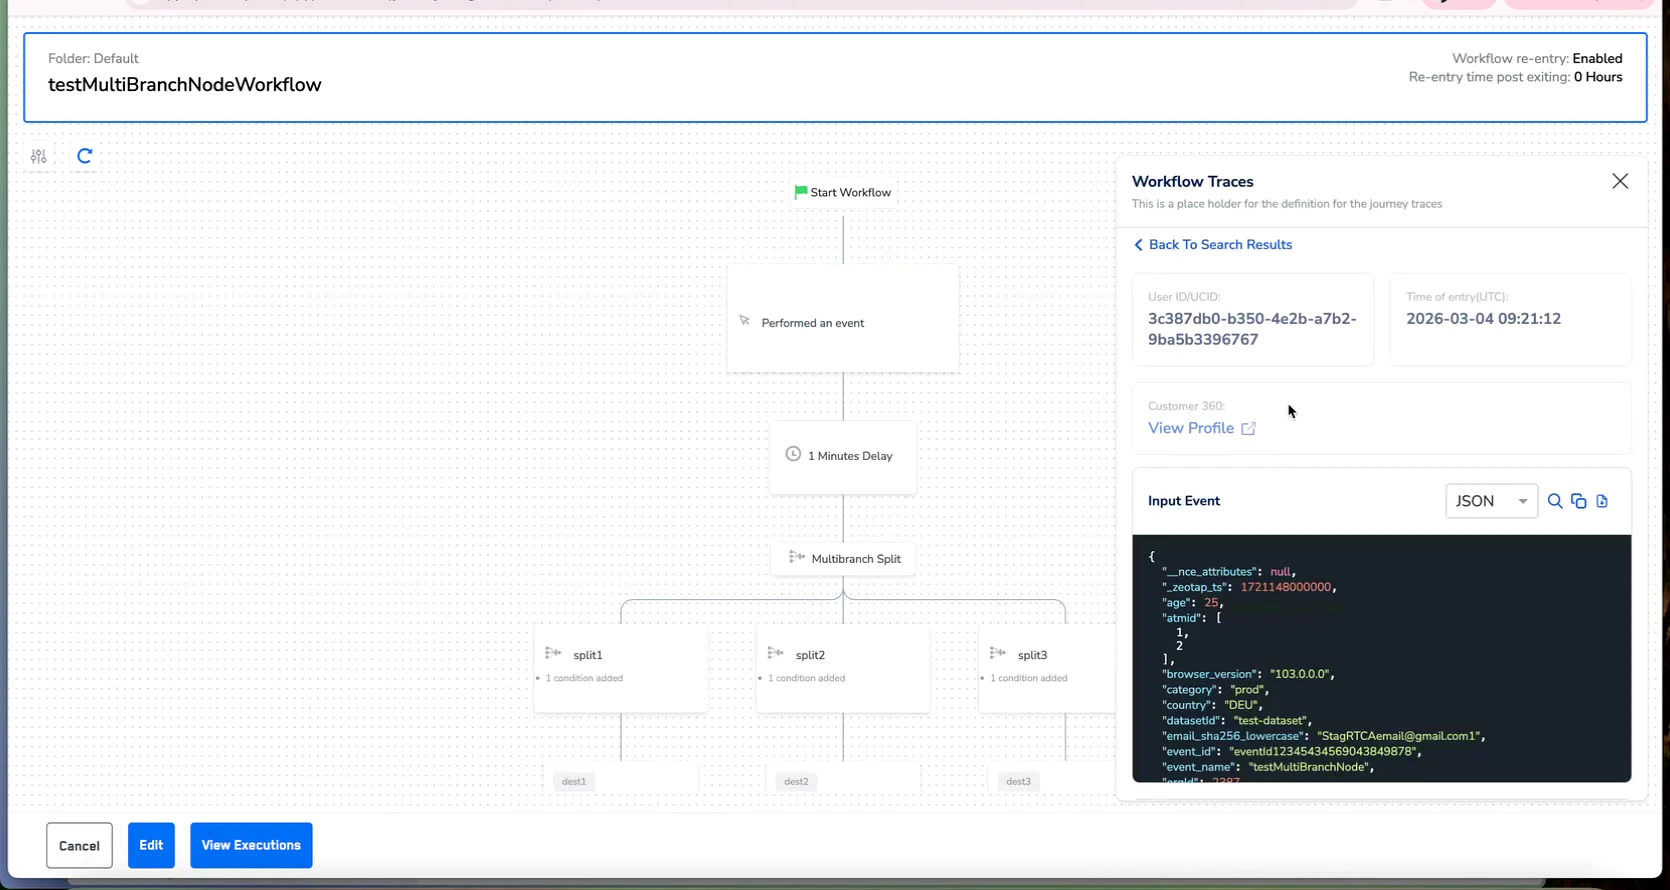
Clicking on a trace result opens the full trace detail view — the core of the Journey Traces debugging experience. This view provides comprehensive information about the selected user's journey execution.
### 5.1 Trace Detail Header
| Field | Description | Example |
| ---------------------- | ------------------------------------------------------ | ---------------------------- |
| Back to Search Results | Navigation link to return to the trace list | ← Back To Search Results |
| UUID | The full trace UUID for this specific execution record | `b387Abd1-b090-4a3b-a752...` |
| Timestamp | Exact date and time of the execution | 2026-03-04 09:25:12 |
| Profile ID | The Zeotap internal profile identifier for the user | `9cbb33961f7` |
| View Profile | Direct link to the user's Customer 360 profile | View Profile → |
### 4.2 Time Range Filtering
Use the time filter dropdown (displayed as **"Last 7 Days"** by default) to narrow results to a specific date range. This is particularly useful when:
* You know approximately when an issue occurred
* You want to compare traces across different execution windows
* You need to focus on the most recent executions for active debugging
### 4.3 Interpreting Search Results
Each trace result in the list shows three key pieces of information:
* **UUID** — The unique identifier string for the trace (e.g., `b387Abd1-b090-4a3b-a752...`)
* **Name/Identifier** — A human-readable name or identifier associated with the user
* **Timestamp** — The exact execution timestamp (e.g., 2026-03-04 09:08:12)
***
## 5. Inspecting a Trace Record
Clicking on a trace result opens the full trace detail view — the core of the Journey Traces debugging experience. This view provides comprehensive information about the selected user's journey execution.
### 5.1 Trace Detail Header
| Field | Description | Example |
| ---------------------- | ------------------------------------------------------ | ---------------------------- |
| Back to Search Results | Navigation link to return to the trace list | ← Back To Search Results |
| UUID | The full trace UUID for this specific execution record | `b387Abd1-b090-4a3b-a752...` |
| Timestamp | Exact date and time of the execution | 2026-03-04 09:25:12 |
| Profile ID | The Zeotap internal profile identifier for the user | `9cbb33961f7` |
| View Profile | Direct link to the user's Customer 360 profile | View Profile → |
 ### 5.2 Trace Detail Sections
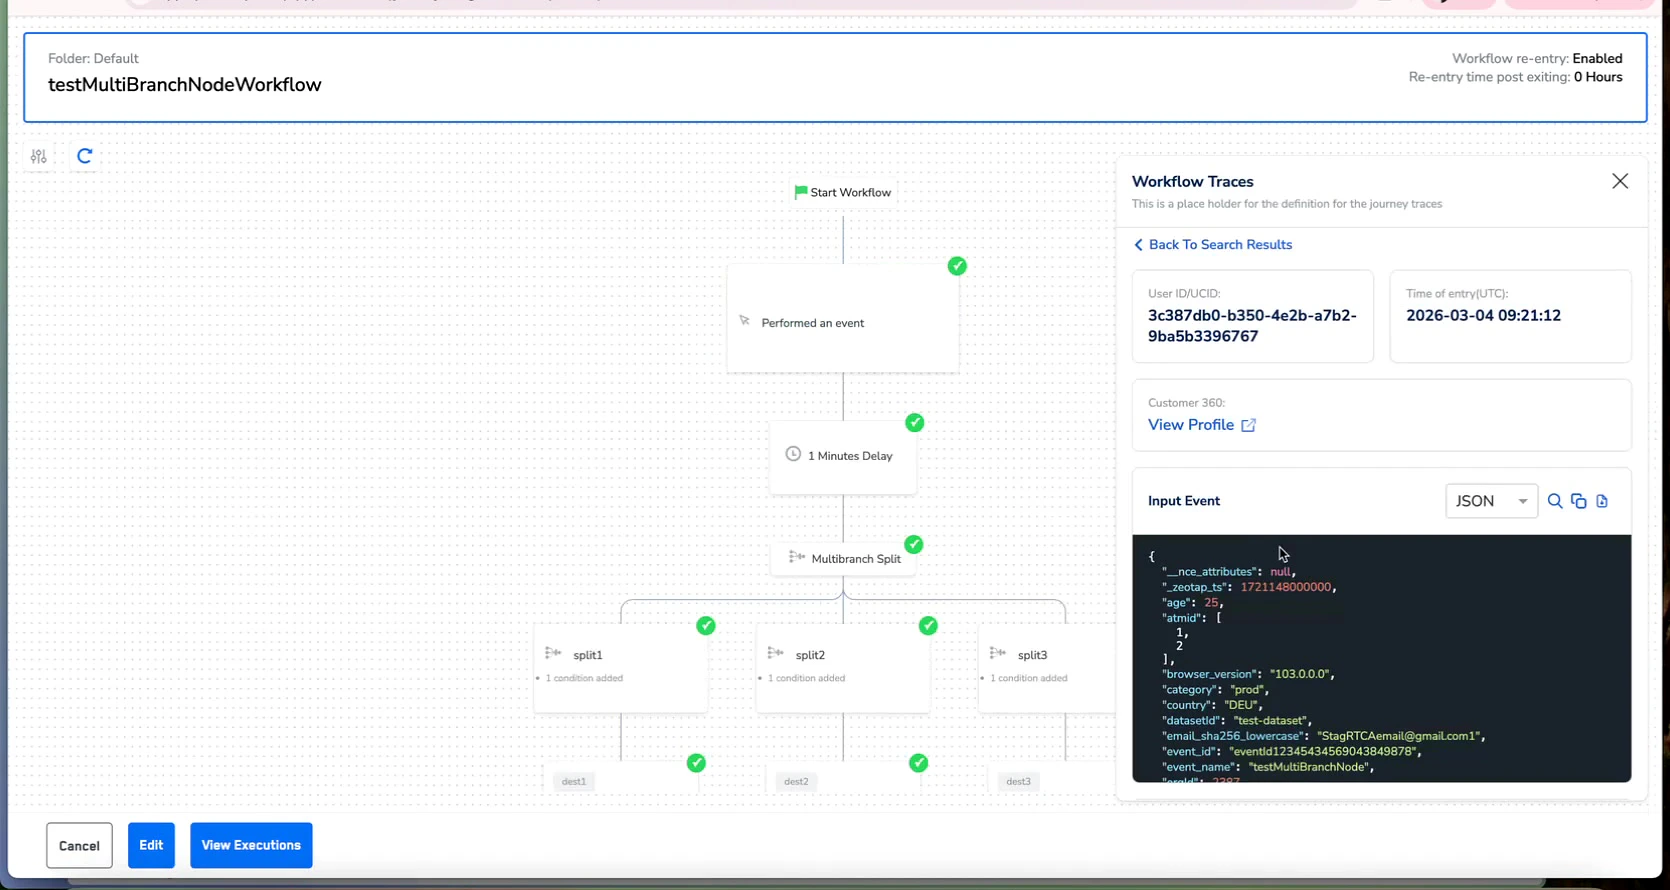
Below the header, the trace detail view is divided into two primary sections:
* **Input Event** — The raw event data that entered the journey for this user. Shows the complete JSON payload with all customer attributes, event metadata, and identifiers.
* **Output Event** — The transformed event data sent to each destination. Includes a dropdown to select which destination's output to view.
**JSON vs. Raw Toggle**
Both sections provide a **JSON / Raw** toggle in the top-right corner. The JSON view provides formatted, syntax-highlighted data. The Raw view shows the unformatted string — useful for copying payloads into external debugging tools or API testing environments.
***
## 6. Understanding Input Event Data
The Input Event section displays the complete raw event that triggered the journey for the selected user. This is the data as received by the Orchestrate engine **before** any transformation, filtering, or routing logic was applied.
### 6.1 Input Event Structure
| JSON Field | Description | Use for Debugging |
| ---------------- | --------------------------------------------------------------------------------- | ------------------------------------------------------------------------- |
| `cus_attributes` | Customer attributes object containing all profile data fields. | Verify expected attributes are present and correctly populated. |
| `event_name` | The name of the event that triggered the journey (e.g., `page_view`, `purchase`). | Confirm the correct trigger event is firing for this journey. |
| `event_id` | A unique identifier for this specific event instance. | Trace a single event end-to-end across systems. |
| `timestamp` | The time the event was received/processed by the platform. | Cross-reference with destination logs for timing analysis. |
| `journey_id` | The ID of the journey that processed this event. | Confirm the event was processed by the correct journey. |
| `execution_id` | A unique ID for this particular journey execution run. | Correlate with execution history for aggregate analysis. |
| `ucid` | The Unified Customer ID — uniquely identifies the customer profile. | Look up the user profile in Customer 360 or perform string match lookups. |
### 5.2 Trace Detail Sections
Below the header, the trace detail view is divided into two primary sections:
* **Input Event** — The raw event data that entered the journey for this user. Shows the complete JSON payload with all customer attributes, event metadata, and identifiers.
* **Output Event** — The transformed event data sent to each destination. Includes a dropdown to select which destination's output to view.
**JSON vs. Raw Toggle**
Both sections provide a **JSON / Raw** toggle in the top-right corner. The JSON view provides formatted, syntax-highlighted data. The Raw view shows the unformatted string — useful for copying payloads into external debugging tools or API testing environments.
***
## 6. Understanding Input Event Data
The Input Event section displays the complete raw event that triggered the journey for the selected user. This is the data as received by the Orchestrate engine **before** any transformation, filtering, or routing logic was applied.
### 6.1 Input Event Structure
| JSON Field | Description | Use for Debugging |
| ---------------- | --------------------------------------------------------------------------------- | ------------------------------------------------------------------------- |
| `cus_attributes` | Customer attributes object containing all profile data fields. | Verify expected attributes are present and correctly populated. |
| `event_name` | The name of the event that triggered the journey (e.g., `page_view`, `purchase`). | Confirm the correct trigger event is firing for this journey. |
| `event_id` | A unique identifier for this specific event instance. | Trace a single event end-to-end across systems. |
| `timestamp` | The time the event was received/processed by the platform. | Cross-reference with destination logs for timing analysis. |
| `journey_id` | The ID of the journey that processed this event. | Confirm the event was processed by the correct journey. |
| `execution_id` | A unique ID for this particular journey execution run. | Correlate with execution history for aggregate analysis. |
| `ucid` | The Unified Customer ID — uniquely identifies the customer profile. | Look up the user profile in Customer 360 or perform string match lookups. |
 ### 6.2 Reading the Input Event JSON
When inspecting the Input Event, focus on these debugging priorities:
* **Are all expected fields present?** — Missing fields often explain why conditional branches don't route users as expected.
* **Are field values correct?** — Null or empty values can cause downstream failures.
* **Is the event type correct?** — Check `event_name` to confirm the right trigger event is being processed.
* **Are identifiers populated?** — Ensure `ucid` and other identity fields are present for proper profile resolution.
***
## 7. Understanding Output Event Data
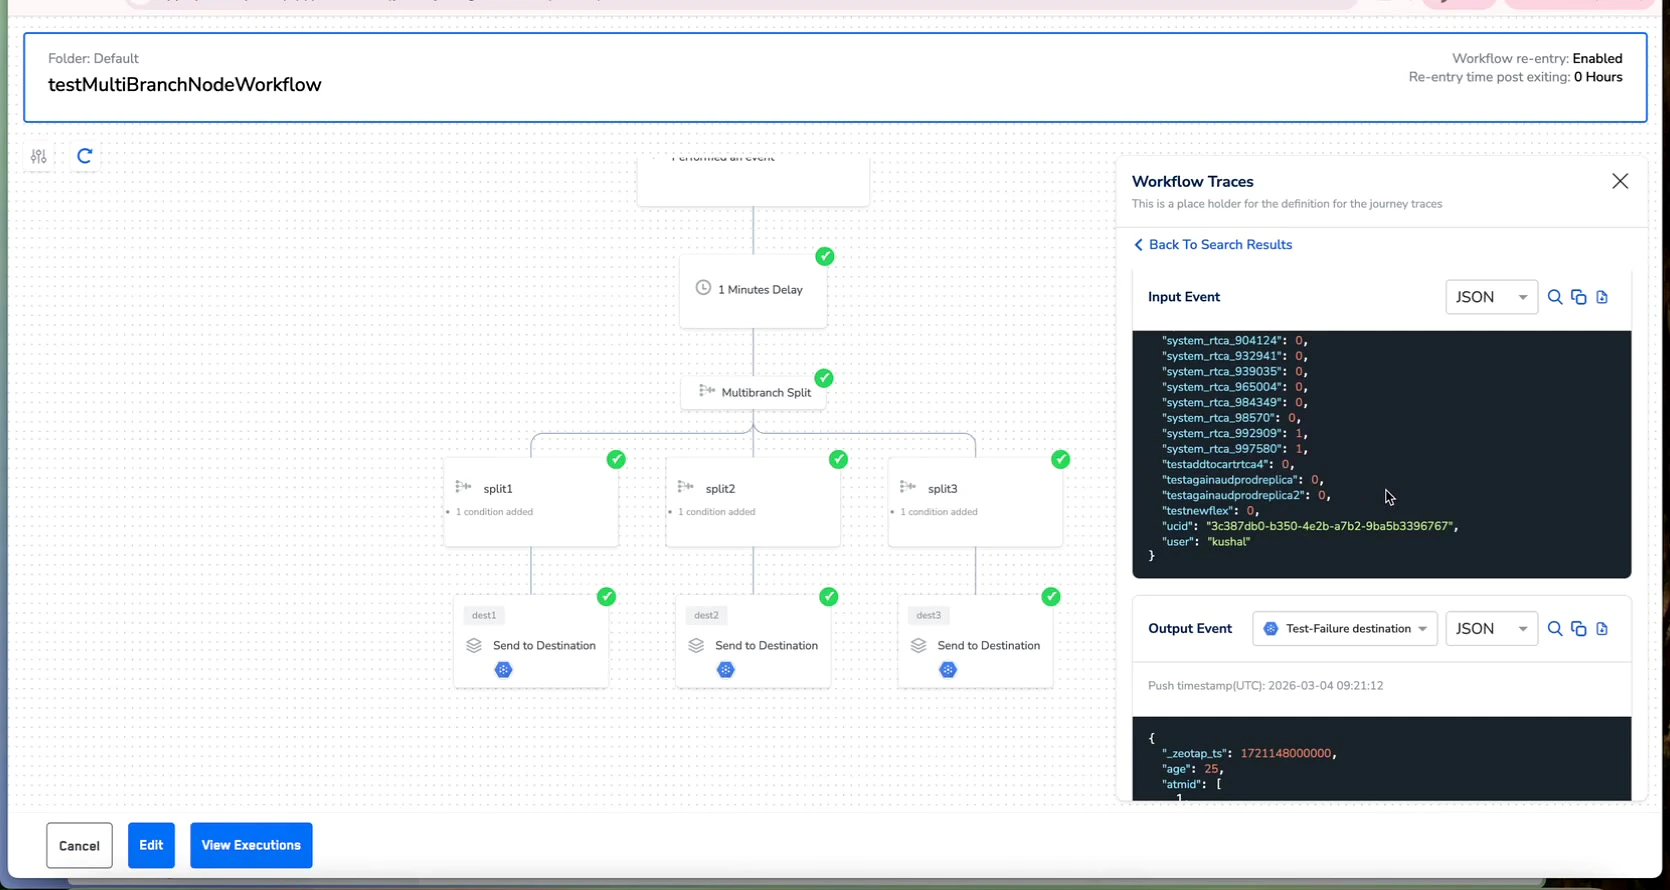
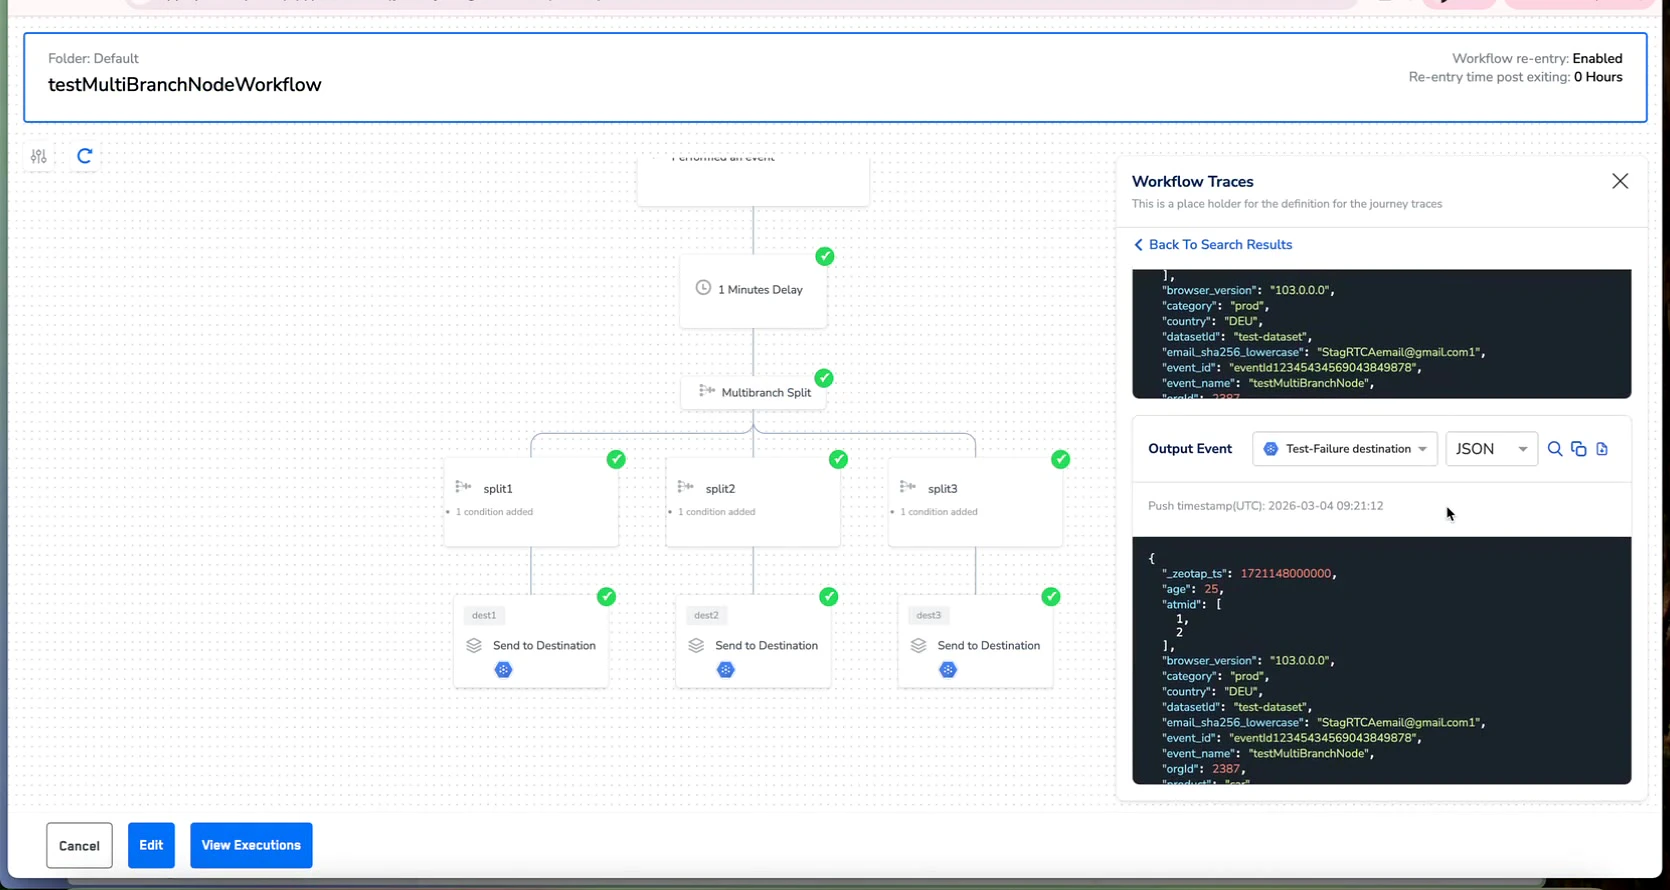
The Output Event section shows the transformed data sent to each destination — the final payload after all journey transformations, field mappings, and enrichments have been applied.
### 7.1 Destination Selector
At the top of the Output Event section, a dropdown selector allows you to choose which destination's output to inspect. Each destination node in the workflow has its own output event payload.
### 6.2 Reading the Input Event JSON
When inspecting the Input Event, focus on these debugging priorities:
* **Are all expected fields present?** — Missing fields often explain why conditional branches don't route users as expected.
* **Are field values correct?** — Null or empty values can cause downstream failures.
* **Is the event type correct?** — Check `event_name` to confirm the right trigger event is being processed.
* **Are identifiers populated?** — Ensure `ucid` and other identity fields are present for proper profile resolution.
***
## 7. Understanding Output Event Data
The Output Event section shows the transformed data sent to each destination — the final payload after all journey transformations, field mappings, and enrichments have been applied.
### 7.1 Destination Selector
At the top of the Output Event section, a dropdown selector allows you to choose which destination's output to inspect. Each destination node in the workflow has its own output event payload.
 ### 7.2 Output Event Structure
The output event JSON contains the transformed and enriched data ready for the destination API:
* **Mapped Fields** — Customer attributes mapped to the destination's expected field names and formats.
* **Destination-Specific Metadata** — Additional metadata required by the destination API (e.g., API keys, list IDs, campaign identifiers).
* **Enriched Data** — Any data added or transformed during journey processing (e.g., computed fields, concatenated values, formatted dates).
### 7.3 Comparing Input vs. Output
Comparing the Input Event with the Output Event side by side reveals:
* **Transformation Issues** — Fields that were incorrectly mapped, truncated, or formatted.
* **Missing Fields** — Input fields expected in the output but absent, indicating a mapping configuration gap.
* **Data Type Mismatches** — Fields that changed type during transformation (e.g., number to string).
* **Enrichment Verification** — Confirm computed or enriched fields are correctly derived from input values.
### 7.2 Output Event Structure
The output event JSON contains the transformed and enriched data ready for the destination API:
* **Mapped Fields** — Customer attributes mapped to the destination's expected field names and formats.
* **Destination-Specific Metadata** — Additional metadata required by the destination API (e.g., API keys, list IDs, campaign identifiers).
* **Enriched Data** — Any data added or transformed during journey processing (e.g., computed fields, concatenated values, formatted dates).
### 7.3 Comparing Input vs. Output
Comparing the Input Event with the Output Event side by side reveals:
* **Transformation Issues** — Fields that were incorrectly mapped, truncated, or formatted.
* **Missing Fields** — Input fields expected in the output but absent, indicating a mapping configuration gap.
* **Data Type Mismatches** — Fields that changed type during transformation (e.g., number to string).
* **Enrichment Verification** — Confirm computed or enriched fields are correctly derived from input values.
 **Multiple Destinations**
If your journey sends data to multiple destinations, use the destination dropdown to check each output independently. A trace may show success for one destination but a transformation issue for another. Always verify all destination outputs when debugging.
***
## 8. Visual Node Path Highlighting
When you open a trace for a specific user, the journey canvas dynamically updates to show the exact path that user took through the workflow.
### 8.1 How Path Highlighting Works
Green checkmark indicators (✓) appear on every node the user qualified for during their journey execution:
* **Entry Point** — The Start Workflow node confirms the user entered the journey.
* **Event Qualification** — The Participate in Event node shows whether the user qualified for the triggering event.
* **Delay Processing** — Wait/Delay nodes show the user passed through the timer.
* **Branch Routing** — In If/Else and Split nodes, only the branch(es) the user was routed to show checkmarks.
* **Destination Delivery** — Send to Destination nodes show whether the user's data reached each configured integration.
**Multiple Destinations**
If your journey sends data to multiple destinations, use the destination dropdown to check each output independently. A trace may show success for one destination but a transformation issue for another. Always verify all destination outputs when debugging.
***
## 8. Visual Node Path Highlighting
When you open a trace for a specific user, the journey canvas dynamically updates to show the exact path that user took through the workflow.
### 8.1 How Path Highlighting Works
Green checkmark indicators (✓) appear on every node the user qualified for during their journey execution:
* **Entry Point** — The Start Workflow node confirms the user entered the journey.
* **Event Qualification** — The Participate in Event node shows whether the user qualified for the triggering event.
* **Delay Processing** — Wait/Delay nodes show the user passed through the timer.
* **Branch Routing** — In If/Else and Split nodes, only the branch(es) the user was routed to show checkmarks.
* **Destination Delivery** — Send to Destination nodes show whether the user's data reached each configured integration.
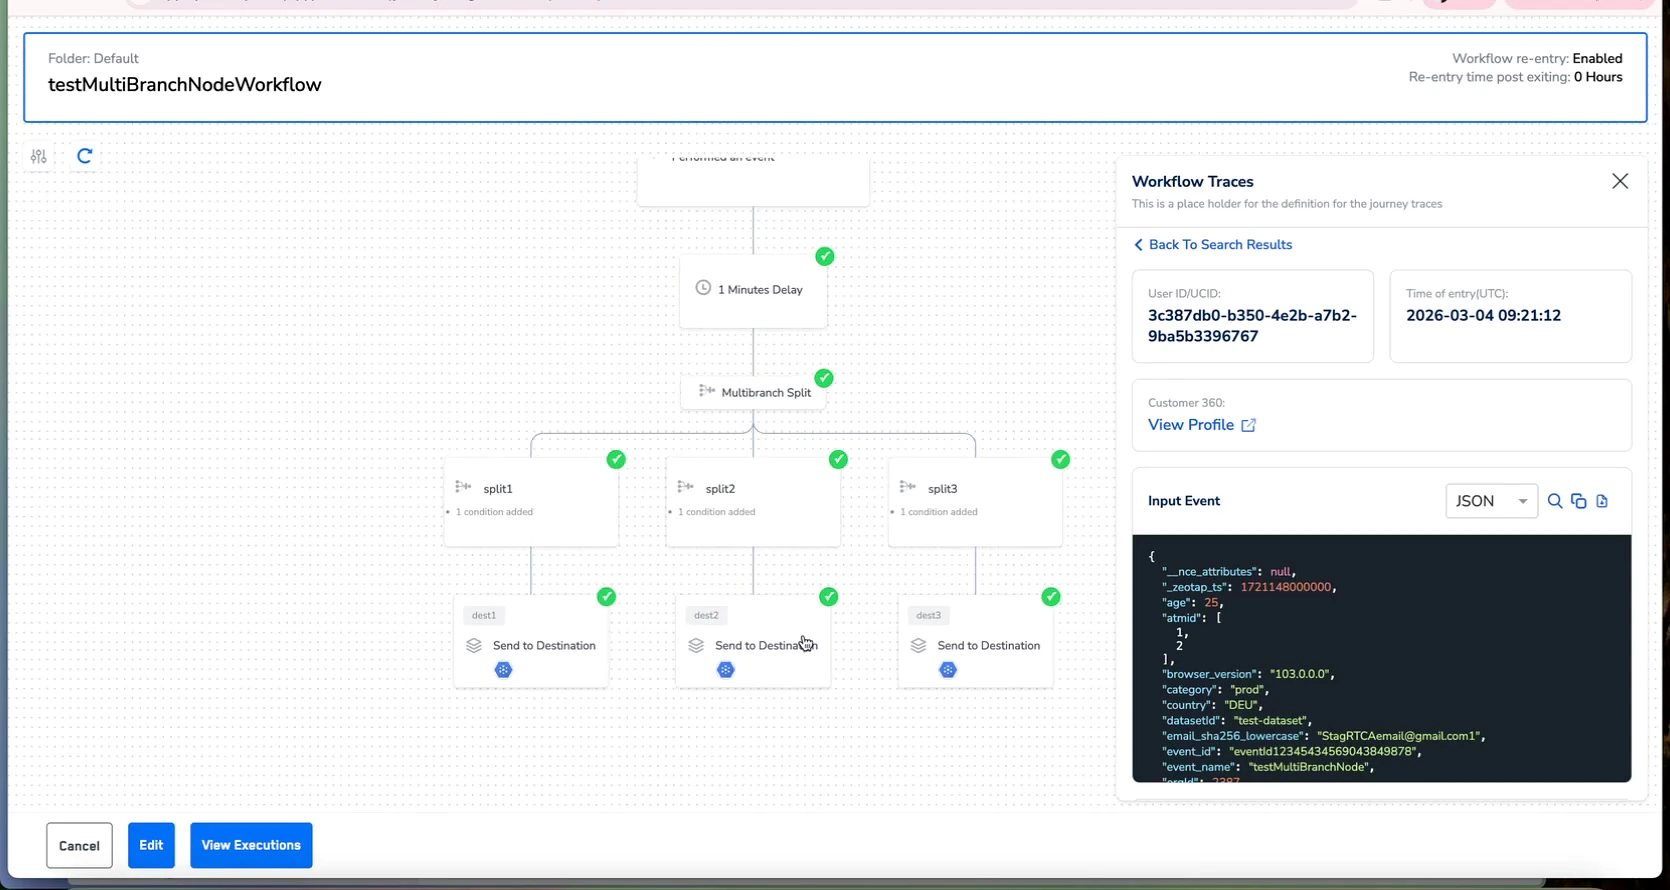 ### 8.2 Reading the Path for Multi-Branch Workflows
For the "testMultiBranchNodeWorkflow" example, path highlighting shows:
* The user entered through the **Start Workflow** node
* Qualified for the **Participate in Event** condition
* Passed through the **5 Minutes Delay** timer
* Was routed through the **Multibranch Split** node
* Flowed down specific **split** branches based on the routing logic
* Reached specific **Send to Destination** nodes — only the ones the user qualified for
**Quick Diagnosis with Path Highlighting**
If a user was expected to reach a specific destination but the green checkmark is missing, look at the last node with a checkmark — the next node in the expected path is where the issue occurred (e.g., a conditional branch that didn't match, or a split that routed elsewhere).
***
## 9. Navigating to Customer 360 from Traces
Journey Traces provides a direct link to the Customer 360 profile for any traced user, enabling seamless cross-module debugging.
### 9.1 Using the View Profile Link
In the trace detail header, find the **View Profile** link displayed below the Profile ID. This link is available for every trace that has a resolved customer profile.
Clicking "View Profile" opens the **Protect > Customer 360** view for the traced user, displaying their complete profile including all identifiers, attributes, and event history.
### 8.2 Reading the Path for Multi-Branch Workflows
For the "testMultiBranchNodeWorkflow" example, path highlighting shows:
* The user entered through the **Start Workflow** node
* Qualified for the **Participate in Event** condition
* Passed through the **5 Minutes Delay** timer
* Was routed through the **Multibranch Split** node
* Flowed down specific **split** branches based on the routing logic
* Reached specific **Send to Destination** nodes — only the ones the user qualified for
**Quick Diagnosis with Path Highlighting**
If a user was expected to reach a specific destination but the green checkmark is missing, look at the last node with a checkmark — the next node in the expected path is where the issue occurred (e.g., a conditional branch that didn't match, or a split that routed elsewhere).
***
## 9. Navigating to Customer 360 from Traces
Journey Traces provides a direct link to the Customer 360 profile for any traced user, enabling seamless cross-module debugging.
### 9.1 Using the View Profile Link
In the trace detail header, find the **View Profile** link displayed below the Profile ID. This link is available for every trace that has a resolved customer profile.
Clicking "View Profile" opens the **Protect > Customer 360** view for the traced user, displaying their complete profile including all identifiers, attributes, and event history.
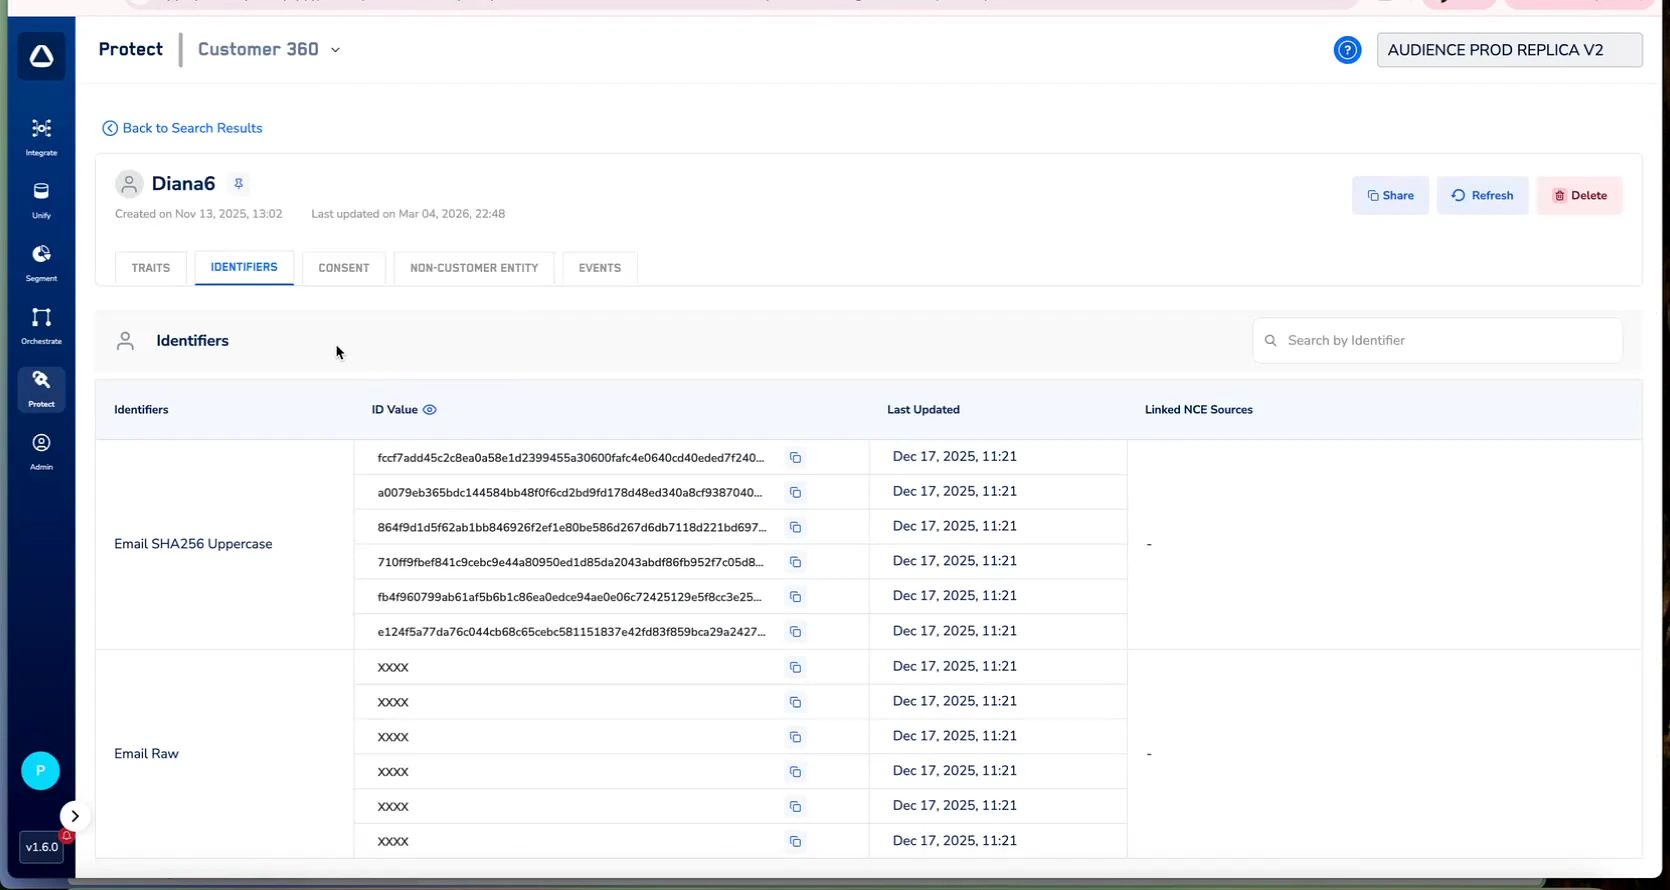 ### 9.2 What You Can Verify in Customer 360
* **Identity Resolution** — Confirm the user has the expected identifiers (Email, Phone, Device ID, etc.) and that identity stitching is correct.
* **Attribute Values** — Check that user attributes match what appeared in the journey trace Input Event.
* **Consent Status** — Verify consent flags that may have caused `CONSENT_NOT_PROVIDED` errors in the journey.
* **Event History** — Review the user's recent events to understand the sequence that led to the journey trigger.
* **Segment Membership** — Confirm the user is part of the expected audience segments that feed the journey.
***
## 10. Key Debugging Fields Reference
### 9.2 What You Can Verify in Customer 360
* **Identity Resolution** — Confirm the user has the expected identifiers (Email, Phone, Device ID, etc.) and that identity stitching is correct.
* **Attribute Values** — Check that user attributes match what appeared in the journey trace Input Event.
* **Consent Status** — Verify consent flags that may have caused `CONSENT_NOT_PROVIDED` errors in the journey.
* **Event History** — Review the user's recent events to understand the sequence that led to the journey trigger.
* **Segment Membership** — Confirm the user is part of the expected audience segments that feed the journey.
***
## 10. Key Debugging Fields Reference
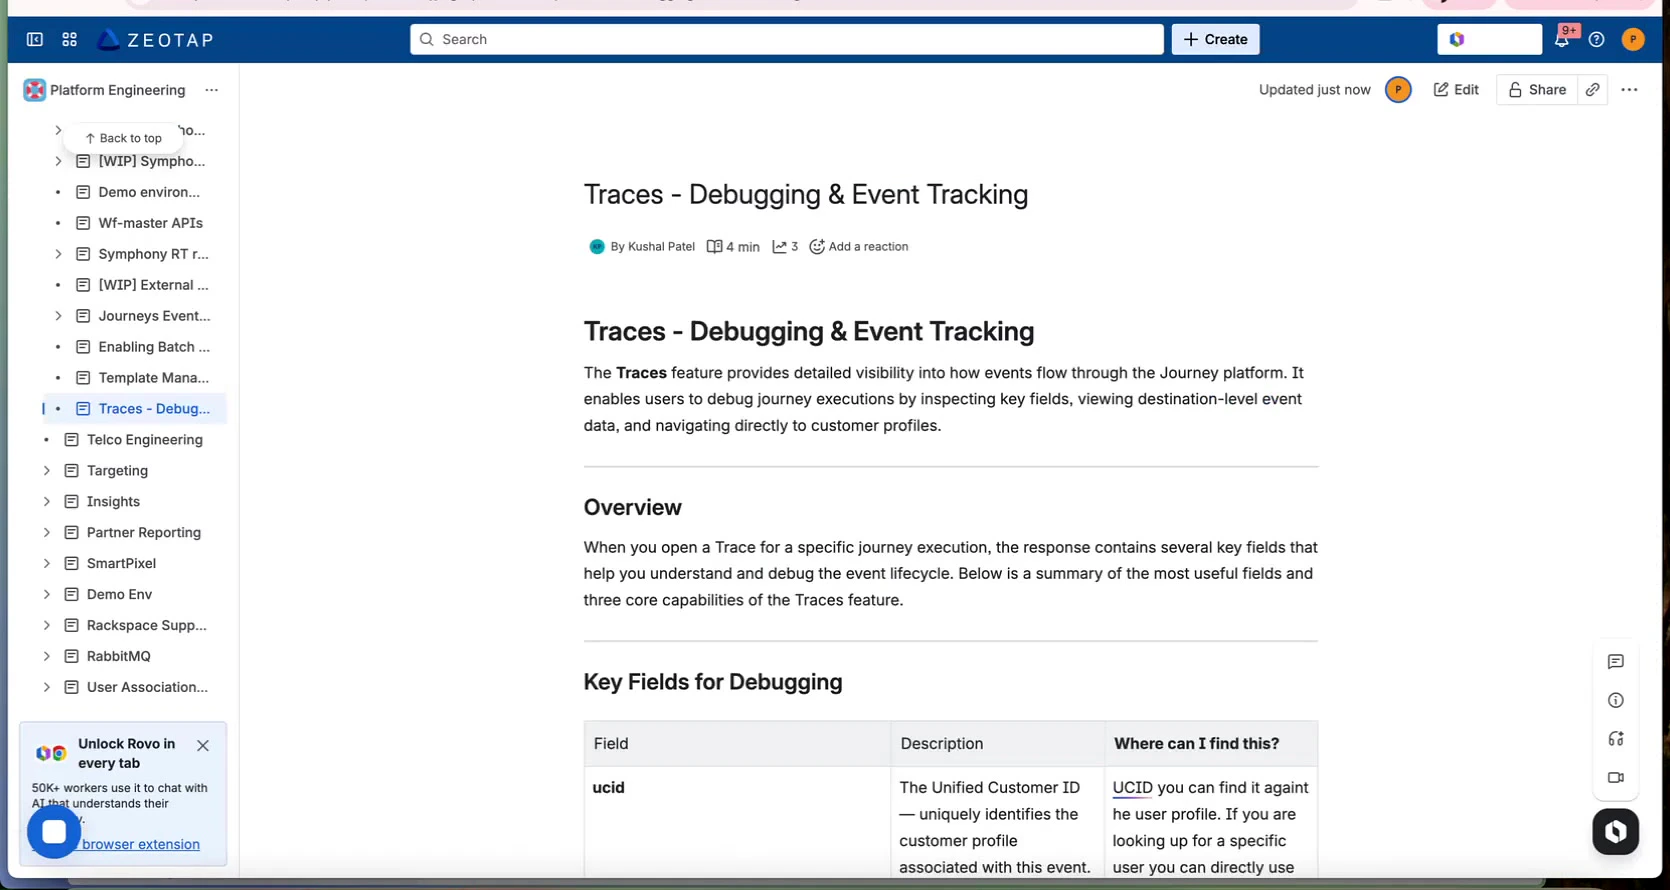 ### 10.1 Trace Header Fields
| Field | Description | Where to Find It |
| -------------- | ------------------------------------------------------------------- | ------------------------------------------------------------------ |
| `ucid` | The Unified Customer ID — uniquely identifies the customer profile. | Trace header. Use to look up the user profile. |
| `event_name` | The name of the event that triggered the journey. | Input Event JSON. Confirms which event type initiated the flow. |
| `event_id` | A unique identifier for this specific event instance. | Input Event JSON. Trace a single event end-to-end. |
| `timestamp` | The time the event was received/processed by the platform. | Trace header and Input Event JSON. |
| `journey_id` | The ID of the journey that processed this event. | Input Event JSON. Confirm the correct journey processed the event. |
| `execution_id` | A unique ID for this particular journey execution run. | Input Event JSON. Correlate with execution history views. |
### 10.2 Additional Lookup Fields
* **String Match / Lookup Identifier** — An alternative identifier for performing string-based searches to find traces for a specific user.
* **Profile ID** — The Zeotap internal profile identifier, directly linkable to Customer 360.
* **Destination Node Name** — Shown in the Output Event dropdown, identifies which destination processed the output.
***
## 11. Common Troubleshooting Scenarios
### 11.1 User Not Reaching Expected Destination
**Symptoms:** A user was expected to receive a message via a specific destination, but they did not.
Search for the user's UUID in the Traces panel.
Identify the last node with a green checkmark on the canvas.
If the user stopped at an If/Else branch, inspect the Input Event to see what attribute values determined the routing.
Compare the user's attribute values against the branch condition to understand why they were routed differently.
### 11.2 Destination Receiving Incorrect Data
**Symptoms:** A destination is receiving data but with wrong or missing field values.
Open the trace for an affected user.
View the **Input Event** and confirm the source data is correct.
Switch to the **Output Event** for the affected destination using the dropdown.
Identify where the transformation diverged.
If fields are missing in the output, check the destination's field mapping configuration.
### 11.3 Users Entering Journey Unexpectedly
**Symptoms:** Users who should not be in a journey are appearing in execution results.
Inspect the **Input Event** for the unexpected user's trace.
Check `event_name` to see what trigger event brought them in.
Click **View Profile** to open Customer 360 and verify segment membership.
Review the journey's entry criteria and audience segment definition for gaps.
### 11.4 Verifying End-to-End Data Flow
**Use Case:** Validate that a journey is correctly processing and delivering data for a test user.
Trigger the journey with a known test user.
Open Traces and search for the test user's UUID.
Confirm green checkmarks appear on all expected nodes.
Inspect the Input Event for correct source data.
Verify correct transformation and delivery for each destination.
Confirm the Customer 360 record is accurate.
***
## 12. Best Practices for Using Traces
### 12.1 Efficient Debugging Workflow
* **Start with the Path** — Always check visual node path highlighting first. It's the fastest way to identify where in the workflow the issue occurred.
* **Compare Input and Output** — For data transformation issues, systematically compare the Input Event JSON with each destination's Output Event JSON.
* **Use the UUID as a Correlation Key** — When working with destination teams, share the trace UUID and execution timestamp for precise cross-system investigation.
* **Check Customer 360 for Identity Issues** — If a user's trace shows unexpected attribute values, use View Profile to verify the underlying profile data.
### 12.2 When to Use Traces vs. View Executions
| Scenario | Use Traces | Use View Executions |
| ---------------------------------------------- | ----------------------- | ------------------------------------- |
| Investigating a single user's journey behavior | ✓ Best choice | Limited — only shows aggregate counts |
| Monitoring overall journey health | Overkill — too granular | ✓ Best choice |
| Debugging data transformation issues | ✓ Best choice | Cannot inspect payloads |
| Checking error rates across executions | Too granular | ✓ Best choice |
| Verifying conditional branch routing | ✓ Best choice | Cannot see per-user paths |
| Validating destination field mappings | ✓ Best choice | Cannot inspect output payloads |
### 12.3 Tips for Complex Workflows
* **Trace Test Users First** — Before launching a new journey, send a test user through and verify the complete trace end-to-end.
* **Save Important UUIDs** — Note the trace UUID and timestamp for future reference and escalation.
* **Check All Destinations** — In multi-destination workflows, always cycle through each destination in the Output Event dropdown.
* **Cross-Reference with Error Reporting** — Combine Journey Traces (per-user debugging) with Journey Error Reporting (aggregate error analysis) for a complete picture.
**Pro Tip: Traces + Error Reporting = Complete Debugging**
Use **Journey Error Reporting** to identify which journeys and nodes are failing at scale, then use **Journey Traces** to drill into specific failing users and inspect the exact data that caused the failure. Together, these tools provide a comprehensive top-down and bottom-up debugging workflow.
***
## 13. Glossary & Quick Reference
### 13.1 Key Terms
| Term | Definition |
| --------------------- | ------------------------------------------------------------------------------------------------------------------------------------------ |
| Journey Trace | A detailed record of a single user's path through a journey workflow, including input event, output events, and node qualification status. |
| Input Event | The raw event data that triggered the journey for a specific user, before any transformation or routing. |
| Output Event | The transformed event data delivered to a destination after journey processing, field mapping, and enrichment. |
| UUID | Universally Unique Identifier — the primary key for searching and identifying individual trace records. |
| UCID | Unified Customer ID — Zeotap's internal identifier that uniquely links a customer profile across all data sources. |
| Path Highlighting | Visual green checkmarks on the journey canvas showing which nodes a traced user qualified for. |
| Customer 360 | The comprehensive customer profile view in the Protect module, accessible via the "View Profile" link in traces. |
| Workflow Traces Panel | The right-side panel on the journey canvas that provides trace search, filtering, and detail inspection. |
| Destination Dropdown | The selector in the Output Event section that lets you switch between different destination outputs. |
### 13.2 Quick Reference: Trace Debugging Checklist
| Step | Action | What to Look For |
| ---- | ------------------------------------ | ---------------------------------------------------------------- |
| 1 | Search by UUID | Confirm the user has a trace record for the expected time window |
| 2 | Check path highlighting | Verify green checkmarks appear on all expected nodes |
| 3 | Inspect Input Event | All required attributes present with correct values |
| 4 | Check Output Event per destination | Transformed data matches expected payload format |
| 5 | Compare Input vs. Output | No unexpected data loss, type changes, or mapping errors |
| 6 | View Profile if needed | Confirm identity resolution and segment membership |
| 7 | Cross-reference with Error Reporting | Correlate individual trace with aggregate error patterns |
***
This document covers Journey Traces as of Zeotap CDP version 2026.1. Features and interface elements may be updated in future releases. Always refer to the latest release notes and in-product documentation for the most current information.
### 10.1 Trace Header Fields
| Field | Description | Where to Find It |
| -------------- | ------------------------------------------------------------------- | ------------------------------------------------------------------ |
| `ucid` | The Unified Customer ID — uniquely identifies the customer profile. | Trace header. Use to look up the user profile. |
| `event_name` | The name of the event that triggered the journey. | Input Event JSON. Confirms which event type initiated the flow. |
| `event_id` | A unique identifier for this specific event instance. | Input Event JSON. Trace a single event end-to-end. |
| `timestamp` | The time the event was received/processed by the platform. | Trace header and Input Event JSON. |
| `journey_id` | The ID of the journey that processed this event. | Input Event JSON. Confirm the correct journey processed the event. |
| `execution_id` | A unique ID for this particular journey execution run. | Input Event JSON. Correlate with execution history views. |
### 10.2 Additional Lookup Fields
* **String Match / Lookup Identifier** — An alternative identifier for performing string-based searches to find traces for a specific user.
* **Profile ID** — The Zeotap internal profile identifier, directly linkable to Customer 360.
* **Destination Node Name** — Shown in the Output Event dropdown, identifies which destination processed the output.
***
## 11. Common Troubleshooting Scenarios
### 11.1 User Not Reaching Expected Destination
**Symptoms:** A user was expected to receive a message via a specific destination, but they did not.
Search for the user's UUID in the Traces panel.
Identify the last node with a green checkmark on the canvas.
If the user stopped at an If/Else branch, inspect the Input Event to see what attribute values determined the routing.
Compare the user's attribute values against the branch condition to understand why they were routed differently.
### 11.2 Destination Receiving Incorrect Data
**Symptoms:** A destination is receiving data but with wrong or missing field values.
Open the trace for an affected user.
View the **Input Event** and confirm the source data is correct.
Switch to the **Output Event** for the affected destination using the dropdown.
Identify where the transformation diverged.
If fields are missing in the output, check the destination's field mapping configuration.
### 11.3 Users Entering Journey Unexpectedly
**Symptoms:** Users who should not be in a journey are appearing in execution results.
Inspect the **Input Event** for the unexpected user's trace.
Check `event_name` to see what trigger event brought them in.
Click **View Profile** to open Customer 360 and verify segment membership.
Review the journey's entry criteria and audience segment definition for gaps.
### 11.4 Verifying End-to-End Data Flow
**Use Case:** Validate that a journey is correctly processing and delivering data for a test user.
Trigger the journey with a known test user.
Open Traces and search for the test user's UUID.
Confirm green checkmarks appear on all expected nodes.
Inspect the Input Event for correct source data.
Verify correct transformation and delivery for each destination.
Confirm the Customer 360 record is accurate.
***
## 12. Best Practices for Using Traces
### 12.1 Efficient Debugging Workflow
* **Start with the Path** — Always check visual node path highlighting first. It's the fastest way to identify where in the workflow the issue occurred.
* **Compare Input and Output** — For data transformation issues, systematically compare the Input Event JSON with each destination's Output Event JSON.
* **Use the UUID as a Correlation Key** — When working with destination teams, share the trace UUID and execution timestamp for precise cross-system investigation.
* **Check Customer 360 for Identity Issues** — If a user's trace shows unexpected attribute values, use View Profile to verify the underlying profile data.
### 12.2 When to Use Traces vs. View Executions
| Scenario | Use Traces | Use View Executions |
| ---------------------------------------------- | ----------------------- | ------------------------------------- |
| Investigating a single user's journey behavior | ✓ Best choice | Limited — only shows aggregate counts |
| Monitoring overall journey health | Overkill — too granular | ✓ Best choice |
| Debugging data transformation issues | ✓ Best choice | Cannot inspect payloads |
| Checking error rates across executions | Too granular | ✓ Best choice |
| Verifying conditional branch routing | ✓ Best choice | Cannot see per-user paths |
| Validating destination field mappings | ✓ Best choice | Cannot inspect output payloads |
### 12.3 Tips for Complex Workflows
* **Trace Test Users First** — Before launching a new journey, send a test user through and verify the complete trace end-to-end.
* **Save Important UUIDs** — Note the trace UUID and timestamp for future reference and escalation.
* **Check All Destinations** — In multi-destination workflows, always cycle through each destination in the Output Event dropdown.
* **Cross-Reference with Error Reporting** — Combine Journey Traces (per-user debugging) with Journey Error Reporting (aggregate error analysis) for a complete picture.
**Pro Tip: Traces + Error Reporting = Complete Debugging**
Use **Journey Error Reporting** to identify which journeys and nodes are failing at scale, then use **Journey Traces** to drill into specific failing users and inspect the exact data that caused the failure. Together, these tools provide a comprehensive top-down and bottom-up debugging workflow.
***
## 13. Glossary & Quick Reference
### 13.1 Key Terms
| Term | Definition |
| --------------------- | ------------------------------------------------------------------------------------------------------------------------------------------ |
| Journey Trace | A detailed record of a single user's path through a journey workflow, including input event, output events, and node qualification status. |
| Input Event | The raw event data that triggered the journey for a specific user, before any transformation or routing. |
| Output Event | The transformed event data delivered to a destination after journey processing, field mapping, and enrichment. |
| UUID | Universally Unique Identifier — the primary key for searching and identifying individual trace records. |
| UCID | Unified Customer ID — Zeotap's internal identifier that uniquely links a customer profile across all data sources. |
| Path Highlighting | Visual green checkmarks on the journey canvas showing which nodes a traced user qualified for. |
| Customer 360 | The comprehensive customer profile view in the Protect module, accessible via the "View Profile" link in traces. |
| Workflow Traces Panel | The right-side panel on the journey canvas that provides trace search, filtering, and detail inspection. |
| Destination Dropdown | The selector in the Output Event section that lets you switch between different destination outputs. |
### 13.2 Quick Reference: Trace Debugging Checklist
| Step | Action | What to Look For |
| ---- | ------------------------------------ | ---------------------------------------------------------------- |
| 1 | Search by UUID | Confirm the user has a trace record for the expected time window |
| 2 | Check path highlighting | Verify green checkmarks appear on all expected nodes |
| 3 | Inspect Input Event | All required attributes present with correct values |
| 4 | Check Output Event per destination | Transformed data matches expected payload format |
| 5 | Compare Input vs. Output | No unexpected data loss, type changes, or mapping errors |
| 6 | View Profile if needed | Confirm identity resolution and segment membership |
| 7 | Cross-reference with Error Reporting | Correlate individual trace with aggregate error patterns |
***
This document covers Journey Traces as of Zeotap CDP version 2026.1. Features and interface elements may be updated in future releases. Always refer to the latest release notes and in-product documentation for the most current information.