> ## Documentation Index
> Fetch the complete documentation index at: https://docs.zeotap.com/llms.txt
> Use this file to discover all available pages before exploring further.
# Observability Hub
> Monitor and manage your audience delivery in real time. See audience health at a glance, diagnose late or failing refreshes, and trace each refresh through every lifecycle stage.
## What is the Observability Hub?
The **Observability Hub** gives you real-time visibility into the health of your audiences — from when a refresh kicks off, all the way through to successful delivery at the destination. Instead of guessing whether your audiences are running on time or reaching their intended destinations, you can monitor, diagnose, and act directly from one central place.
The Observability Hub is currently available as a **Beta** feature. It will continue to be refined based on your feedback. Once enabled for your organisation, it appears under **Labs** in the Zeotap CDP navigation.
### What can you do with it?
* See at a glance whether all your audiences are running and delivering successfully.
* Understand why an audience is late or failing — and which stage in the pipeline is causing it.
* Track delivery history over the last 1 hour, 24 hours, or 7 days.
* View the complete lifecycle trace of an audience refresh, step by step.
* Spot and flag schedule drift when your audiences start firing at different times than expected.
### Who can access it?
All users with the **CDP Admin** or **CDP Manager** role in an enabled organisation can access the Observability Hub.
### How do I get to it?
The Observability Hub is accessible from the **Labs** section in the Zeotap CDP navigation. Clicking on it opens the dashboard in a new tab.
## Audience Health Overview
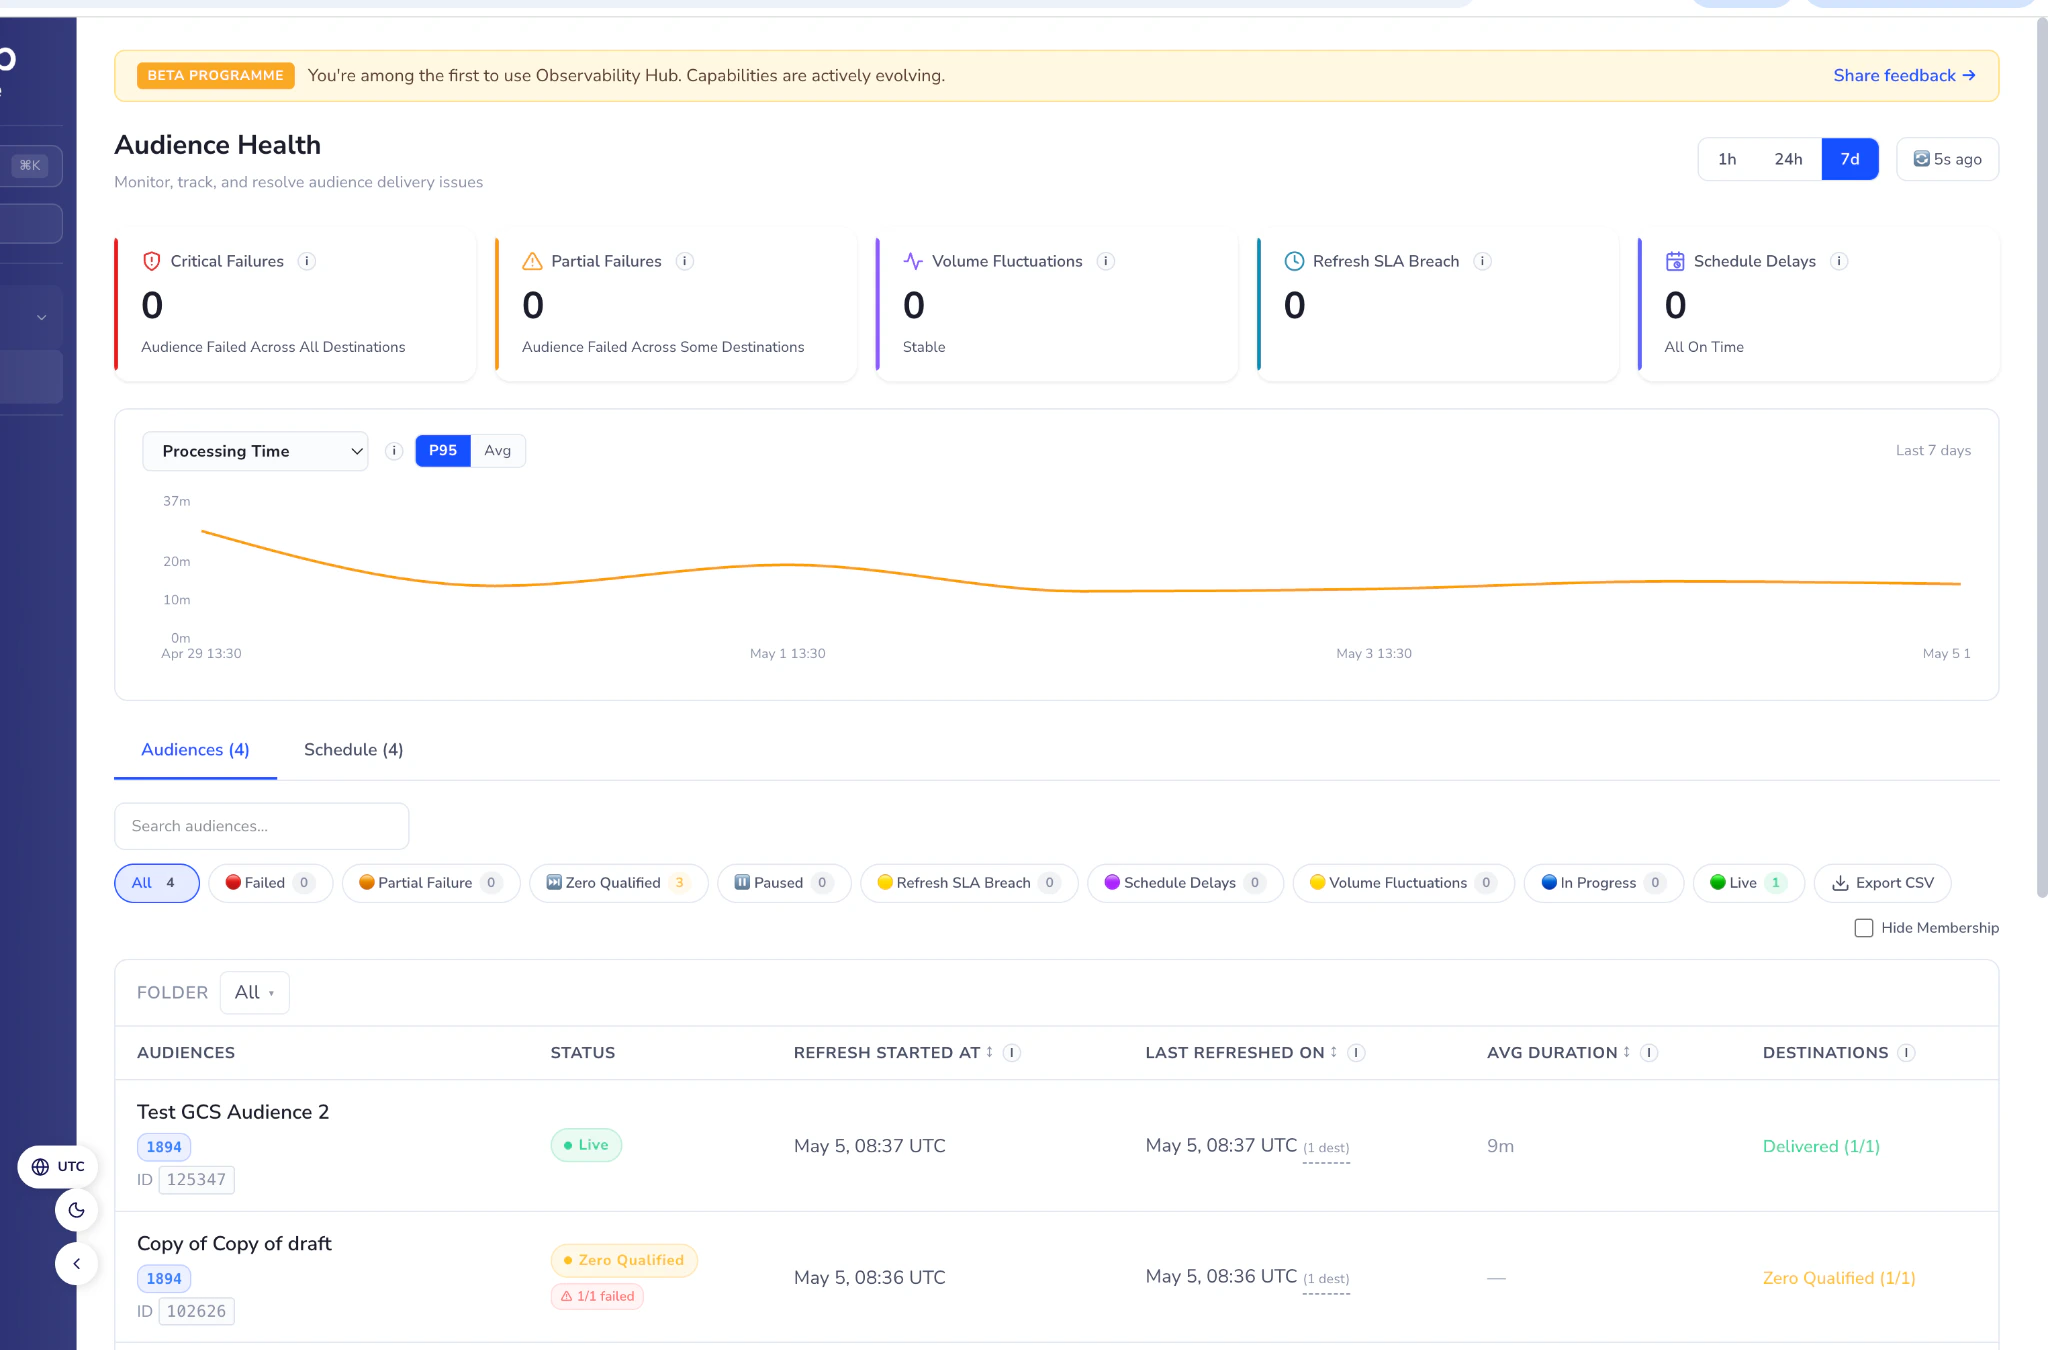
The **Audience Health** page is the main screen you see when you open the Observability Hub. It gives you a high-level picture of how all your audiences are performing, and lets you quickly find any that need attention.
 ### KPI Tiles
Across the top of the page, five tiles give you an instant health summary. Click any tile to filter the audience list below to show only the relevant audiences.
| Tile | What it tells you |
| ----------------------- | ------------------------------------------------------------------------------------------------------------------------------------------------------------------------------------------------------------------------------------------------------- |
| **Critical Failures** | Audiences where the last refresh completely failed — no destination received any data. Needs urgent attention. |
| **Partial Failures** | Audiences where some destinations received data but others failed during the run. |
| **Volume Fluctuations** | Audiences where the number of profiles delivered changed significantly compared to the previous run. An anomaly detection algorithm flags these based on historical patterns and only works once at least 7 days of refresh history has been collected. |
| **Refresh SLA Breach** | Audiences whose last refresh took longer than the expected time limit. The threshold is configurable per organisation. |
| **Schedule Delays** | Audiences with a scheduled cadence that haven't fired within their expected window. The threshold is configurable per organisation. |
### Time Range Filter
Use the time range selector in the top-right corner to control how much history you see:
* **1h** — last 1 hour
* **24h** — last 24 hours
* **7d** — last 7 days *(default)*
This filter applies to all information on the **Audiences** tab. After applying a filter, the list shows every audience whose refresh ran within that window, and each row reflects the latest state of that audience based on its most recent run.
There can be a latency of around **10 minutes** before the latest status is reflected in the dashboard.
### Processing Time Chart
Below the summary tiles, a chart shows how long audience refreshes are taking over your selected time range. Toggle between **P95** (95th percentile — the longer end of run times) and **Avg** (average) to see whether processing is trending slower than usual.
### Audience List
The main table shows all your audiences. You can search by name, filter by status using the chips above the table, and filter by folder.
#### Status filter chips
Click any chip to see only audiences with that status. Click **All** to clear the filter.
| Status | What it means |
| -------------------------- | --------------------------------------------------------------------------------------------------------------------------------------------------------------------------------------------- |
| 🟢 **Live** | The audience ran successfully and at least one destination received the data. |
| 🔴 **Failed** | The last refresh failed completely — no destination received data. |
| 🟠 **Partial Failure** | Some destinations received data, but others failed during this run. |
| ⬜ **Zero Qualified** | The audience matched 0 profiles at the last refresh. No data was sent. This is not necessarily an error — it may indicate the audience filters are very narrow or the source data is missing. |
| ⏸️ **Paused** | The audience has been paused and will not auto-refresh until resumed. |
| 🟡 **Refresh SLA Breach** | The latest refresh took longer than the configured time limit. |
| 🟣 **Schedule Delays** | The audience has a schedule but has not fired within its expected threshold window. |
| 🟡 **Volume Fluctuations** | The number of delivered profiles changed significantly compared to the previous run. |
| 🔵 **In Progress** | The audience is currently being processed or delivered right now. |
#### Audience table columns
| Column | What it shows |
| ---------------------- | -------------------------------------------------------------------------------- |
| **Audience** | The audience name and ID. Click to open the Audience Detail page. |
| **Status** | The current delivery status of this audience. |
| **Refresh Started At** | When the most recent refresh began. Sortable. |
| **Last Refreshed On** | When the most recent refresh completed. Hover to see a breakdown by destination. |
| **Avg Duration** | The average time this audience takes to refresh, over the selected time window. |
| **Destinations** | A summary of delivery status across all destinations linked to this audience. |
## Audience Detail
Click any audience name to open the **Audience Detail** page. This gives you a deeper view into that specific audience — its current status, recent changes, and delivery results for each connected destination.
### KPI Tiles
Across the top of the page, five tiles give you an instant health summary. Click any tile to filter the audience list below to show only the relevant audiences.
| Tile | What it tells you |
| ----------------------- | ------------------------------------------------------------------------------------------------------------------------------------------------------------------------------------------------------------------------------------------------------- |
| **Critical Failures** | Audiences where the last refresh completely failed — no destination received any data. Needs urgent attention. |
| **Partial Failures** | Audiences where some destinations received data but others failed during the run. |
| **Volume Fluctuations** | Audiences where the number of profiles delivered changed significantly compared to the previous run. An anomaly detection algorithm flags these based on historical patterns and only works once at least 7 days of refresh history has been collected. |
| **Refresh SLA Breach** | Audiences whose last refresh took longer than the expected time limit. The threshold is configurable per organisation. |
| **Schedule Delays** | Audiences with a scheduled cadence that haven't fired within their expected window. The threshold is configurable per organisation. |
### Time Range Filter
Use the time range selector in the top-right corner to control how much history you see:
* **1h** — last 1 hour
* **24h** — last 24 hours
* **7d** — last 7 days *(default)*
This filter applies to all information on the **Audiences** tab. After applying a filter, the list shows every audience whose refresh ran within that window, and each row reflects the latest state of that audience based on its most recent run.
There can be a latency of around **10 minutes** before the latest status is reflected in the dashboard.
### Processing Time Chart
Below the summary tiles, a chart shows how long audience refreshes are taking over your selected time range. Toggle between **P95** (95th percentile — the longer end of run times) and **Avg** (average) to see whether processing is trending slower than usual.
### Audience List
The main table shows all your audiences. You can search by name, filter by status using the chips above the table, and filter by folder.
#### Status filter chips
Click any chip to see only audiences with that status. Click **All** to clear the filter.
| Status | What it means |
| -------------------------- | --------------------------------------------------------------------------------------------------------------------------------------------------------------------------------------------- |
| 🟢 **Live** | The audience ran successfully and at least one destination received the data. |
| 🔴 **Failed** | The last refresh failed completely — no destination received data. |
| 🟠 **Partial Failure** | Some destinations received data, but others failed during this run. |
| ⬜ **Zero Qualified** | The audience matched 0 profiles at the last refresh. No data was sent. This is not necessarily an error — it may indicate the audience filters are very narrow or the source data is missing. |
| ⏸️ **Paused** | The audience has been paused and will not auto-refresh until resumed. |
| 🟡 **Refresh SLA Breach** | The latest refresh took longer than the configured time limit. |
| 🟣 **Schedule Delays** | The audience has a schedule but has not fired within its expected threshold window. |
| 🟡 **Volume Fluctuations** | The number of delivered profiles changed significantly compared to the previous run. |
| 🔵 **In Progress** | The audience is currently being processed or delivered right now. |
#### Audience table columns
| Column | What it shows |
| ---------------------- | -------------------------------------------------------------------------------- |
| **Audience** | The audience name and ID. Click to open the Audience Detail page. |
| **Status** | The current delivery status of this audience. |
| **Refresh Started At** | When the most recent refresh began. Sortable. |
| **Last Refreshed On** | When the most recent refresh completed. Hover to see a breakdown by destination. |
| **Avg Duration** | The average time this audience takes to refresh, over the selected time window. |
| **Destinations** | A summary of delivery status across all destinations linked to this audience. |
## Audience Detail
Click any audience name to open the **Audience Detail** page. This gives you a deeper view into that specific audience — its current status, recent changes, and delivery results for each connected destination.
 ### Header information
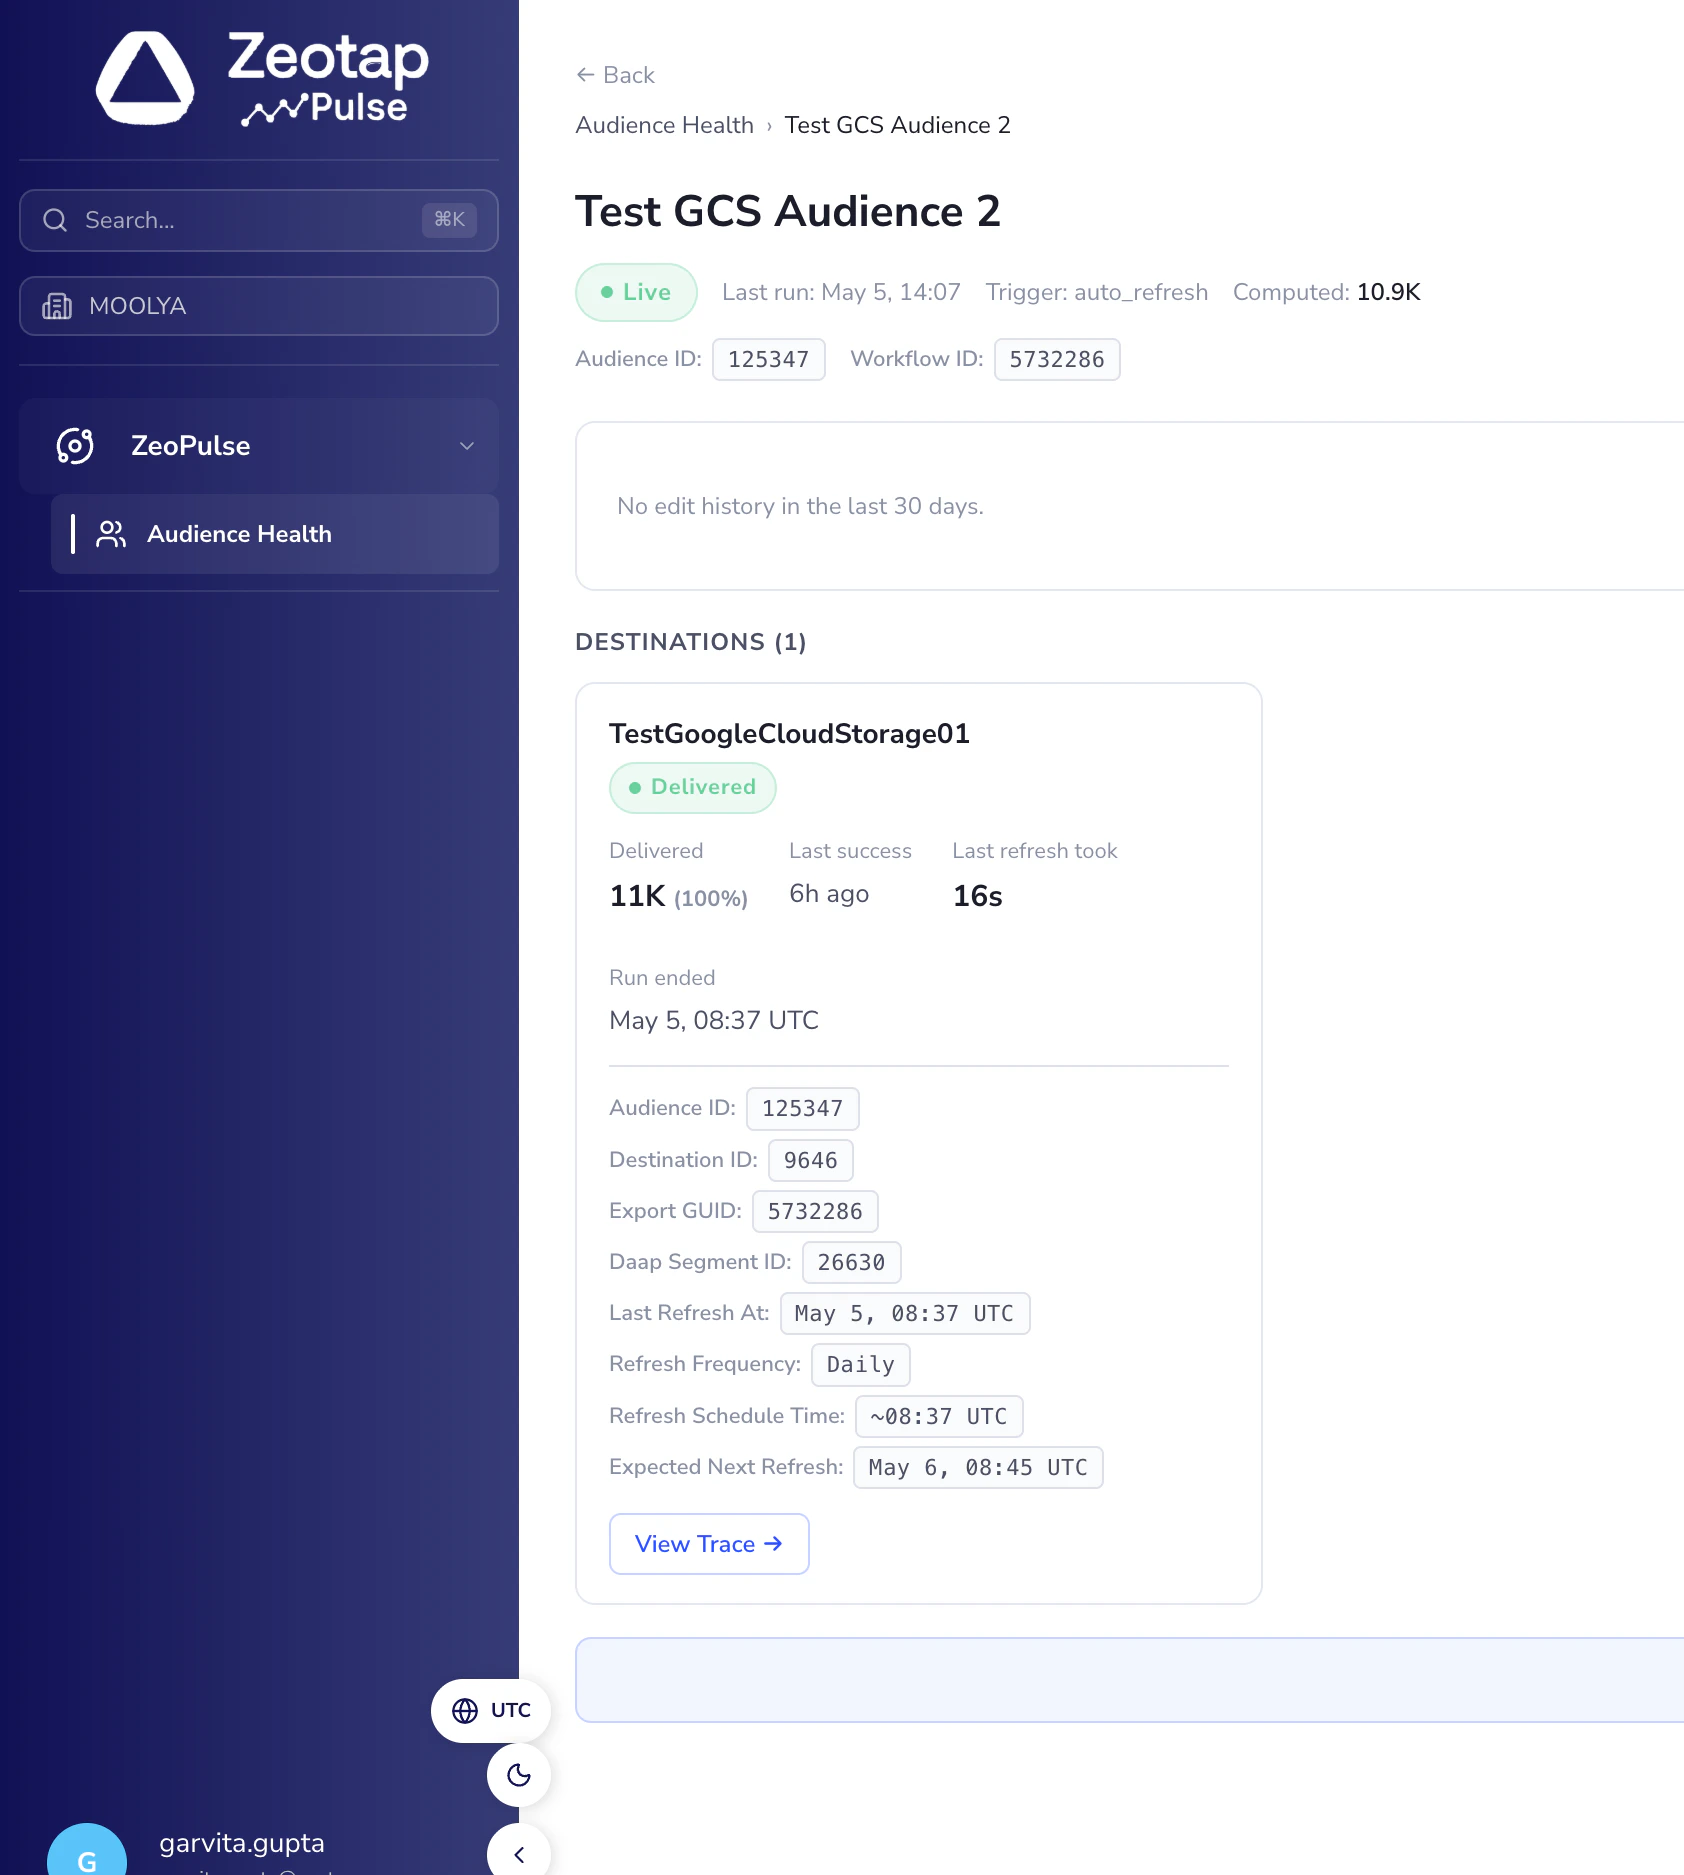
At the top of the page you'll see:
* The audience name and its current status (e.g., **Live**, **Failed**, **Paused**).
* When it last ran and what triggered it — for example, `auto_refresh` for scheduled runs or `manual` for user-triggered runs.
* The **Audience ID** and **Workflow ID** — useful when raising support requests.
### Change History
This panel shows a record of recent changes made to this audience, including who made the change and when. It covers:
* Audience rule edits
* Pause and resume actions
* Name changes and scheduling updates
### Destination Cards
Each destination linked to this audience has its own card. The card shows you exactly how that specific delivery channel is performing.
| Field | What it means |
| -------------------------------- | ------------------------------------------------------------------------------------------------------------------------------- |
| **Status** | Whether this destination received the data successfully, is in progress, or failed. |
| **Last success** | How long ago this destination last received data successfully. |
| **Last refresh took** | How long the most recent delivery to this destination took, end to end. |
| **Run ended** | The exact timestamp when the last run for this destination completed. |
| **Refresh Frequency** | How often this audience–destination pair is configured to refresh (e.g., Daily). |
| **Refresh Schedule Time** | The time of day the most recent auto-refresh actually ran. Marked with `~` because the platform rounds to 15-minute boundaries. |
| **Expected Next Refresh** | When the next refresh is projected to run, based on the last trigger time and configured frequency. |
| **Audience ID / Destination ID** | Reference IDs used in support requests. Click to copy. |
| **Daap Segment ID** | The platform identifier for this audience–destination pair. Useful for support tickets. |
### Viewing the full lifecycle trace
Each destination card has a **View Trace** button. This opens a step-by-step timeline of everything that happened during the last refresh for that destination — from when the audience was computed, through enrichment, upload, and final delivery confirmation.
You can also click **View Full Lifecycle Trace (all destinations)** at the bottom of the page to see a combined view across every destination linked to the audience.
## Lifecycle Trace
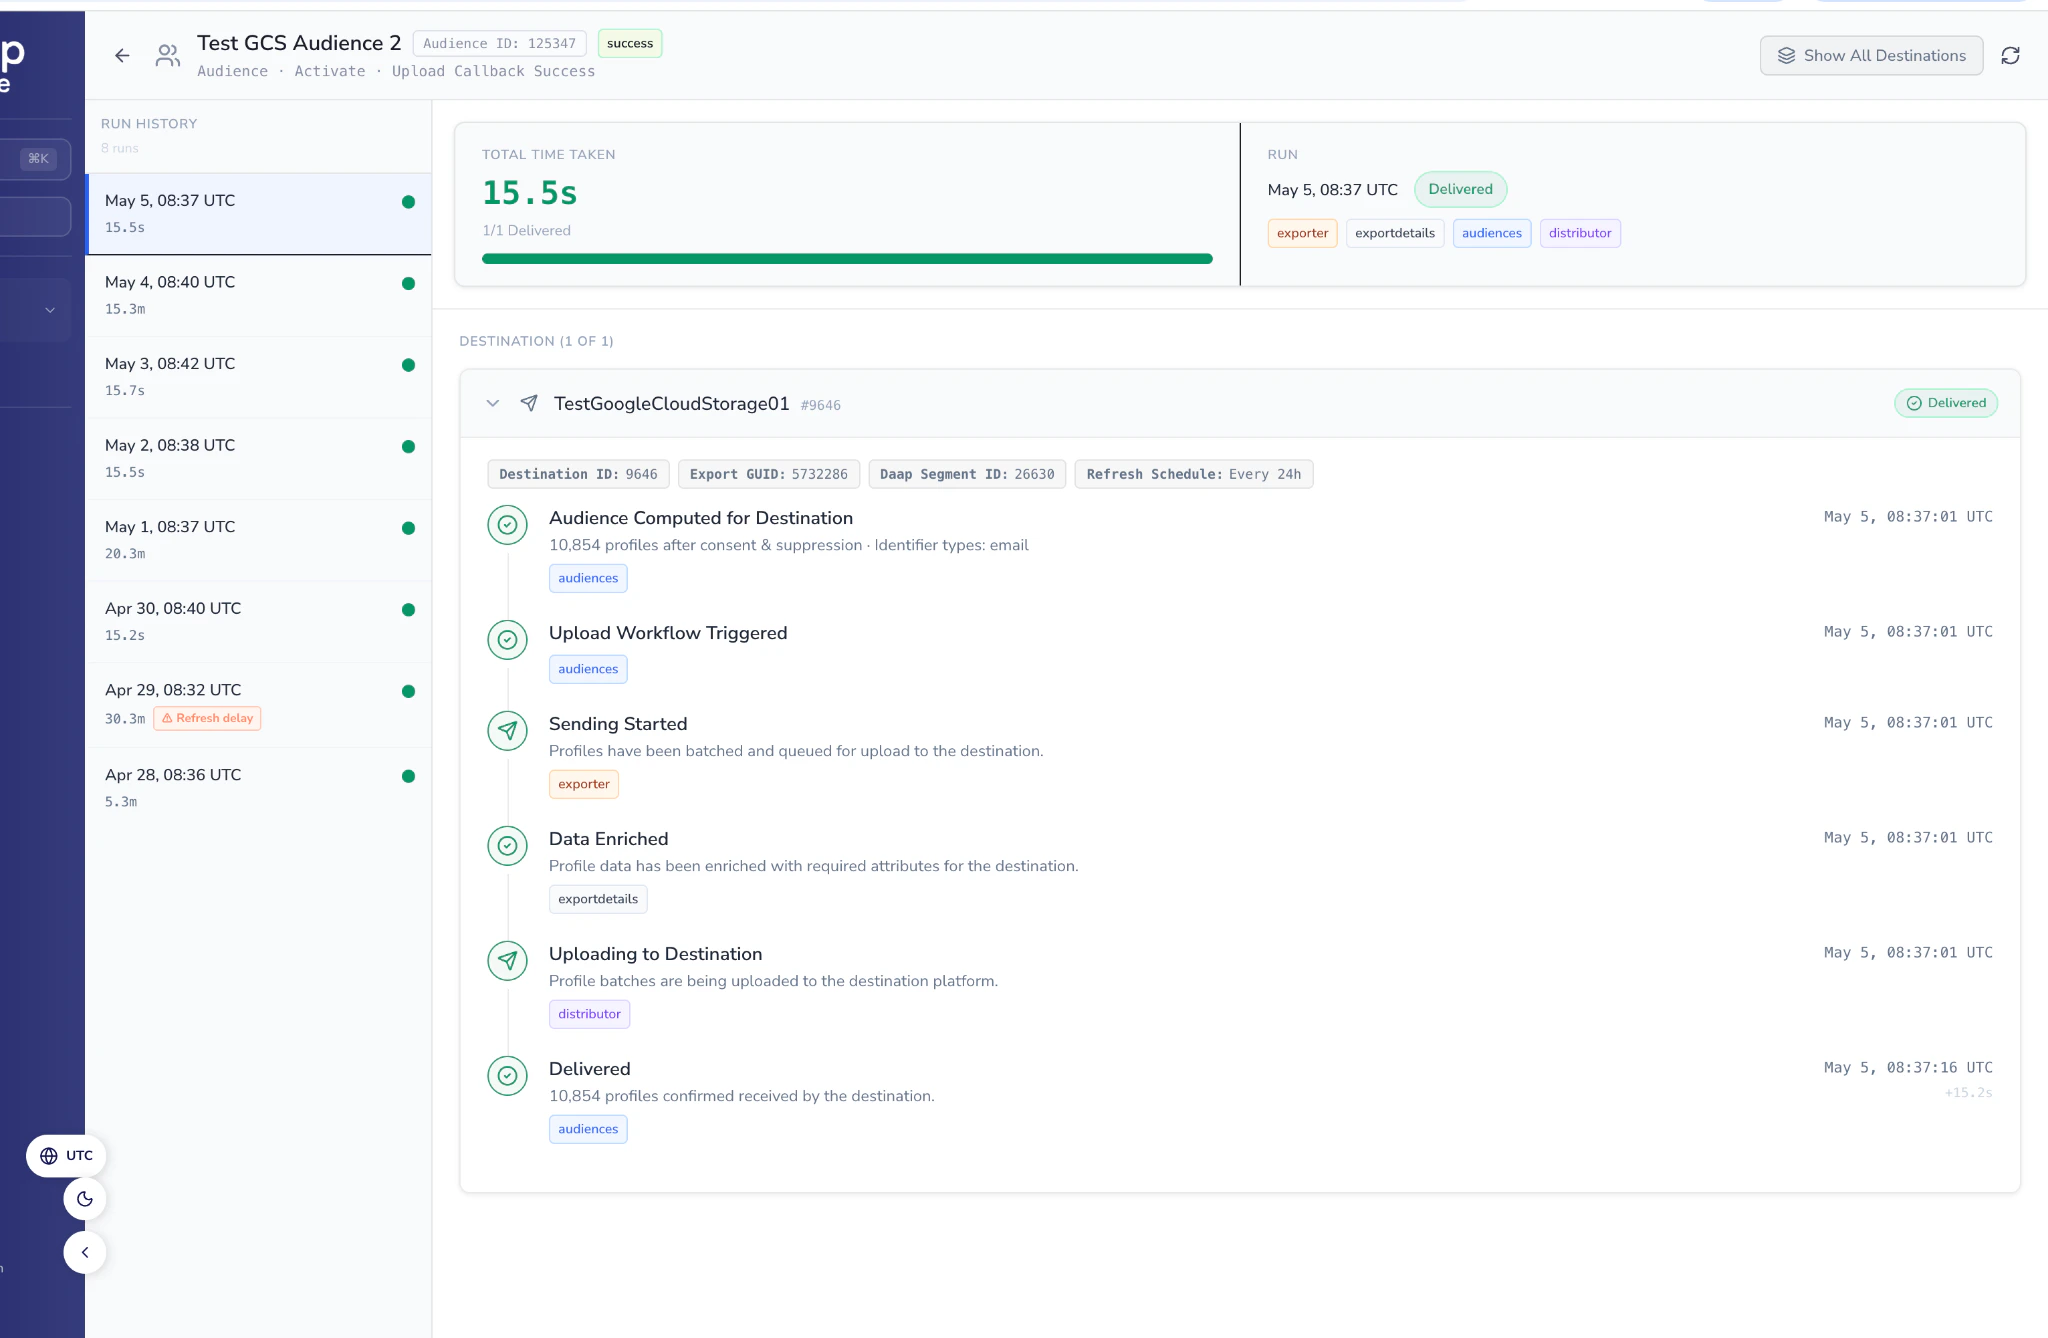
The **Lifecycle Trace** shows you every stage of an audience refresh, in sequence, with timestamps. This is the most detailed view available and is particularly useful when you need to understand exactly what happened during a specific run.
### Header information
At the top of the page you'll see:
* The audience name and its current status (e.g., **Live**, **Failed**, **Paused**).
* When it last ran and what triggered it — for example, `auto_refresh` for scheduled runs or `manual` for user-triggered runs.
* The **Audience ID** and **Workflow ID** — useful when raising support requests.
### Change History
This panel shows a record of recent changes made to this audience, including who made the change and when. It covers:
* Audience rule edits
* Pause and resume actions
* Name changes and scheduling updates
### Destination Cards
Each destination linked to this audience has its own card. The card shows you exactly how that specific delivery channel is performing.
| Field | What it means |
| -------------------------------- | ------------------------------------------------------------------------------------------------------------------------------- |
| **Status** | Whether this destination received the data successfully, is in progress, or failed. |
| **Last success** | How long ago this destination last received data successfully. |
| **Last refresh took** | How long the most recent delivery to this destination took, end to end. |
| **Run ended** | The exact timestamp when the last run for this destination completed. |
| **Refresh Frequency** | How often this audience–destination pair is configured to refresh (e.g., Daily). |
| **Refresh Schedule Time** | The time of day the most recent auto-refresh actually ran. Marked with `~` because the platform rounds to 15-minute boundaries. |
| **Expected Next Refresh** | When the next refresh is projected to run, based on the last trigger time and configured frequency. |
| **Audience ID / Destination ID** | Reference IDs used in support requests. Click to copy. |
| **Daap Segment ID** | The platform identifier for this audience–destination pair. Useful for support tickets. |
### Viewing the full lifecycle trace
Each destination card has a **View Trace** button. This opens a step-by-step timeline of everything that happened during the last refresh for that destination — from when the audience was computed, through enrichment, upload, and final delivery confirmation.
You can also click **View Full Lifecycle Trace (all destinations)** at the bottom of the page to see a combined view across every destination linked to the audience.
## Lifecycle Trace
The **Lifecycle Trace** shows you every stage of an audience refresh, in sequence, with timestamps. This is the most detailed view available and is particularly useful when you need to understand exactly what happened during a specific run.
 ### What you'll see
The span trace is organised chronologically from top to bottom. Each step is labelled, timestamped, and tagged with the component responsible. The glossary below explains every span you may see.
#### Span glossary
| Span | Description |
| ------------------------------------- | --------------------------------------------------------------------------------------------------------------------------------------------------------------------------------------- |
| **Refresh Started** | The audience refresh has been triggered — either by the auto-refresh scheduler or a manual user action. The platform is working out which profiles currently match your audience rules. |
| **Audience Built** | The audience is ready. The number of profiles shown here is the total that matched audience rules before any destination-specific filters were applied. |
| **Audience Computed for Destination** | The audience has been tailored for this specific destination. Any consent restrictions or suppression lists have been applied. The profile count here is what will actually be sent. |
| **Upload Workflow Triggered** | The delivery process has been kicked off. Your audience data is being prepared for transfer to the destination. |
| **Data Enriched** | Profile records have been prepared in the format your destination expects — for example, applying the right identifiers or field mappings required by that platform. |
| **Sending Started** | Your audience data has been packaged into batches and is ready to be sent. Delivery to the destination is about to begin. |
| **Uploading to Destination** | Data is actively being transferred to the destination platform. For large audiences, this can take a few minutes. |
| **Delivered** | The destination confirmed it received your audience data. The profile count shown here is what the destination platform acknowledged. This is the final successful state. |
| **Computation Failed** | Something went wrong while building your audience. No data was sent to any destination for this run. Contact support if this keeps happening. |
| **Destination Computation Failed** | The audience could not be prepared for this specific destination. Other destinations linked to the same audience may have been unaffected. |
| **Delivery Retrying** | A temporary issue was encountered while sending. The platform is automatically trying again — no action is needed from your side yet. |
| **Delivery Failed** | The data could not be sent to the destination after multiple attempts. Check the error message on the destination card for next steps. |
| **Delivery Confirmation Failed** | The data was sent, but the destination did not confirm receipt. It's unclear whether the data was accepted — please contact support if you see this. |
### Run History
On the left side of the trace view, a run history panel lists previous runs with their duration and status. Click any past run to view its trace. This makes it easy to compare what happened across different days.
## How Schedules Work
Most audiences are set up to refresh automatically on a recurring schedule — for example, once a day at a set time. The platform runs these refreshes automatically based on the configured cadence, so your audience data stays up to date without any manual action.
The **Refresh Schedule Time** on each destination card shows when the most recent refresh actually ran. **Expected Next Refresh** is calculated from that, giving you a forward-looking view of when to expect the next update.
A few things can affect when your audience refreshes:
* **Pausing and resuming an audience** may shift when it next fires, depending on when it was resumed relative to its original schedule. The new timing is reflected from the next run onwards.
* **Schedule changes** — whether made by you or by the Zeotap support team on your request — show up in the system with a lag of around **10–15 minutes**. The schedule-delay calculation catches up from the next run, so there may be a brief window after a change where the expected timing looks slightly off. This corrects itself automatically.
## Common Workflows
Step-by-step guides for the situations you're most likely to encounter.
### Why is this audience late? / Are all my audiences running on time?
Open the **Audience Health** page and find the audience in the table.
Click the audience name to open its detail page.
Is it **In Progress**, **Failed**, or something else?
Was the audience paused and recently resumed? That would push the schedule forward.
Check each destination card and compare **Refresh Schedule Time** (when it actually fires now) with **Expected Next Refresh**.
If you see an amber drift pill, the schedule has shifted — click it to flag for reset.
### Why is delivery to a specific destination failing?
Open the **Audience Detail** page for the affected audience.
Find the failing destination card and read the error message. Click **see more** if it's truncated.
Click **View Trace** to see the step-by-step lifecycle. The failing span shows you exactly which stage failed.
If the same destination is failing across multiple audiences, check whether other audiences are also experiencing failures to the same destination — that points to a destination-side issue rather than something specific to this audience.
## Getting Help
The Observability Hub is in **Beta**. Some features are still being developed and you may occasionally encounter issues. Your feedback helps us improve — please share anything you notice.
### What's available in this release
In this beta release, the **Audience Health** view and **Lifecycle Trace** are fully available. The **Destinations** tab and **User Actions** tab will be enabled in an upcoming release.
### Contact us
* **To enable the Observability Hub for your organisation** — contact your Zeotap account manager or Customer Success Manager.
* **For bugs, data inconsistencies, or urgent questions** — reach out to Zeotap support.
* **For general feedback and feature suggestions** — share via the **Share feedback** link in the Beta banner at the top of the dashboard.
### What you'll see
The span trace is organised chronologically from top to bottom. Each step is labelled, timestamped, and tagged with the component responsible. The glossary below explains every span you may see.
#### Span glossary
| Span | Description |
| ------------------------------------- | --------------------------------------------------------------------------------------------------------------------------------------------------------------------------------------- |
| **Refresh Started** | The audience refresh has been triggered — either by the auto-refresh scheduler or a manual user action. The platform is working out which profiles currently match your audience rules. |
| **Audience Built** | The audience is ready. The number of profiles shown here is the total that matched audience rules before any destination-specific filters were applied. |
| **Audience Computed for Destination** | The audience has been tailored for this specific destination. Any consent restrictions or suppression lists have been applied. The profile count here is what will actually be sent. |
| **Upload Workflow Triggered** | The delivery process has been kicked off. Your audience data is being prepared for transfer to the destination. |
| **Data Enriched** | Profile records have been prepared in the format your destination expects — for example, applying the right identifiers or field mappings required by that platform. |
| **Sending Started** | Your audience data has been packaged into batches and is ready to be sent. Delivery to the destination is about to begin. |
| **Uploading to Destination** | Data is actively being transferred to the destination platform. For large audiences, this can take a few minutes. |
| **Delivered** | The destination confirmed it received your audience data. The profile count shown here is what the destination platform acknowledged. This is the final successful state. |
| **Computation Failed** | Something went wrong while building your audience. No data was sent to any destination for this run. Contact support if this keeps happening. |
| **Destination Computation Failed** | The audience could not be prepared for this specific destination. Other destinations linked to the same audience may have been unaffected. |
| **Delivery Retrying** | A temporary issue was encountered while sending. The platform is automatically trying again — no action is needed from your side yet. |
| **Delivery Failed** | The data could not be sent to the destination after multiple attempts. Check the error message on the destination card for next steps. |
| **Delivery Confirmation Failed** | The data was sent, but the destination did not confirm receipt. It's unclear whether the data was accepted — please contact support if you see this. |
### Run History
On the left side of the trace view, a run history panel lists previous runs with their duration and status. Click any past run to view its trace. This makes it easy to compare what happened across different days.
## How Schedules Work
Most audiences are set up to refresh automatically on a recurring schedule — for example, once a day at a set time. The platform runs these refreshes automatically based on the configured cadence, so your audience data stays up to date without any manual action.
The **Refresh Schedule Time** on each destination card shows when the most recent refresh actually ran. **Expected Next Refresh** is calculated from that, giving you a forward-looking view of when to expect the next update.
A few things can affect when your audience refreshes:
* **Pausing and resuming an audience** may shift when it next fires, depending on when it was resumed relative to its original schedule. The new timing is reflected from the next run onwards.
* **Schedule changes** — whether made by you or by the Zeotap support team on your request — show up in the system with a lag of around **10–15 minutes**. The schedule-delay calculation catches up from the next run, so there may be a brief window after a change where the expected timing looks slightly off. This corrects itself automatically.
## Common Workflows
Step-by-step guides for the situations you're most likely to encounter.
### Why is this audience late? / Are all my audiences running on time?
Open the **Audience Health** page and find the audience in the table.
Click the audience name to open its detail page.
Is it **In Progress**, **Failed**, or something else?
Was the audience paused and recently resumed? That would push the schedule forward.
Check each destination card and compare **Refresh Schedule Time** (when it actually fires now) with **Expected Next Refresh**.
If you see an amber drift pill, the schedule has shifted — click it to flag for reset.
### Why is delivery to a specific destination failing?
Open the **Audience Detail** page for the affected audience.
Find the failing destination card and read the error message. Click **see more** if it's truncated.
Click **View Trace** to see the step-by-step lifecycle. The failing span shows you exactly which stage failed.
If the same destination is failing across multiple audiences, check whether other audiences are also experiencing failures to the same destination — that points to a destination-side issue rather than something specific to this audience.
## Getting Help
The Observability Hub is in **Beta**. Some features are still being developed and you may occasionally encounter issues. Your feedback helps us improve — please share anything you notice.
### What's available in this release
In this beta release, the **Audience Health** view and **Lifecycle Trace** are fully available. The **Destinations** tab and **User Actions** tab will be enabled in an upcoming release.
### Contact us
* **To enable the Observability Hub for your organisation** — contact your Zeotap account manager or Customer Success Manager.
* **For bugs, data inconsistencies, or urgent questions** — reach out to Zeotap support.
* **For general feedback and feature suggestions** — share via the **Share feedback** link in the Beta banner at the top of the dashboard.